Mean Formula Calculator
Complete statistics guide • Step-by-step solutions
Mean Formula::
Show the calculator /Simulator\( \bar{x} = \frac{\sum_{i=1}^{n} x_i}{n} \)
The mean (or arithmetic mean) is the sum of all values divided by the number of values. It's the most common measure of central tendency, representing the average value in a dataset. The mean is sensitive to outliers and provides a balanced measure of the dataset's center.
Where:
- \(\bar{x}\) = sample mean
- \(\sum_{i=1}^{n} x_i\) = sum of all data values
- \(n\) = number of values in the dataset
The mean is widely used in statistics, economics, science, and everyday applications. It provides a single value that represents the central location of a dataset, making it easier to compare different datasets or track changes over time.
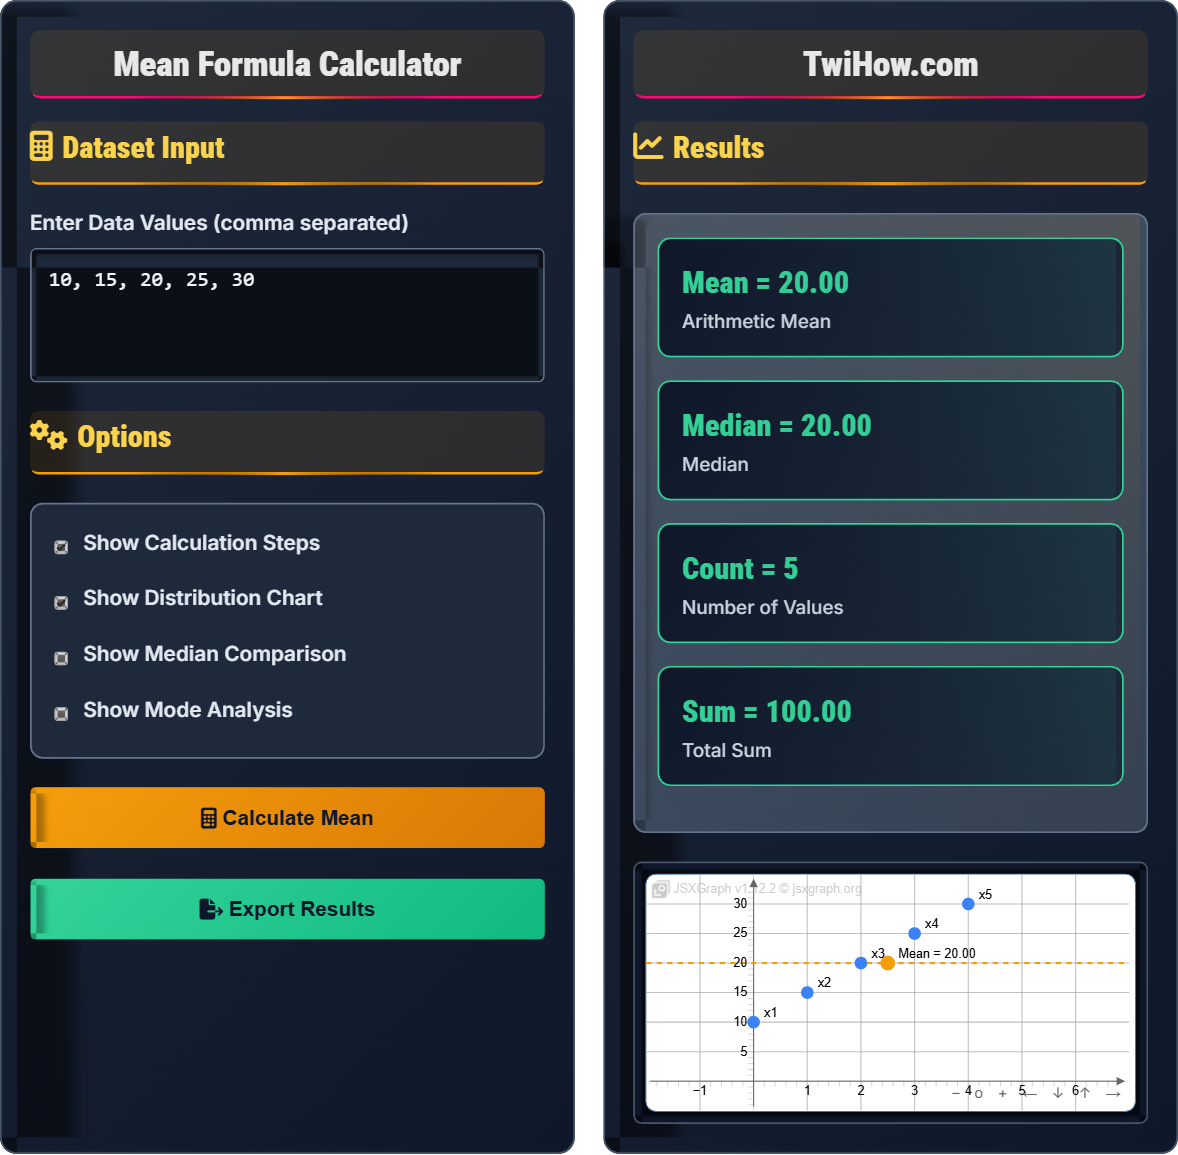
Dataset Input
Options
Results
| Index | Value | Deviation | Squared Deviation |
|---|
Enter data to see calculation steps.
Additional statistics will appear here.
Mean Formula Explained
The mean (arithmetic mean) is the most commonly used measure of central tendency in statistics. It represents the average value of a dataset and is calculated by adding all values together and dividing by the count of values. The mean is sensitive to outliers and provides a balance point for the distribution of data.
The arithmetic mean formula is:
Where:
- \(\bar{x}\) = sample mean
- \(\sum_{i=1}^{n} x_i\) = sum of all data values
- \(x_i\) = individual data values
- \(n\) = total number of values
Key characteristics of the mean:
- Sensitive to Outliers: Extreme values can significantly affect the mean
- Balance Point: The sum of deviations from the mean equals zero
- Always Exists: Every dataset has a unique mean
- Unit Consistency: The mean has the same units as the original data
- Symmetric Distributions: Best for normally distributed data
- No Extreme Outliers: When data doesn't contain extreme values
- Interval/Ratio Data: For continuous numerical data
- Further Calculations: When planning additional statistical analyses
Mean Fundamentals
The arithmetic mean is the sum of all values divided by the number of values.
\( \bar{x} = \frac{\sum_{i=1}^{n} x_i}{n} \)
Where x̄ = mean, Σxi = sum of values, n = count.
- Requires numerical data
- Sensitive to extreme values
- Always between min and max values
- Sum of deviations equals zero
Applications
Central tendency indicator, used with median and mode.
- Academic grading systems
- Economic indicators (GDP per capita)
- Quality control in manufacturing
- Research and experimental data analysis
- Outliers can skew results
- May not represent typical value
- Only meaningful for numerical data
- Assumes symmetric distribution
Mean Formula Learning Quiz
What is the mean of the dataset: 5, 10, 15, 20, 25?
Using the mean formula: Mean = (Sum of all values) / (Number of values)
Sum = 5 + 10 + 15 + 20 + 25 = 75
Count = 5
Mean = 75 / 5 = 15
The answer is B) 15.
The mean calculation involves two basic steps: addition and division. First, we add all the values in the dataset to get the total sum. Then, we divide this sum by the number of values to find the average. This process gives us a single value that represents the central tendency of the dataset.
Mean: The average value of a dataset
Central Tendency: A measure that describes the center of a dataset
Sum: The result of adding all values together
• Mean = Sum of values ÷ Number of values
• Mean is always between the minimum and maximum values
• Mean is affected by every value in the dataset
• Always double-check your addition
• Count the number of values carefully
• The mean is the "balance point" of the data
• Forgetting to divide by the count
• Counting values incorrectly
• Arithmetic errors in addition
Calculate the mean of the dataset: 10, 12, 14, 16, 18, and then recalculate after adding an outlier value of 100. Explain how the outlier affects the mean.
Original dataset: 10, 12, 14, 16, 18
Sum = 10 + 12 + 14 + 16 + 18 = 70
Count = 5
Original Mean = 70 / 5 = 14
New dataset: 10, 12, 14, 16, 18, 100
Sum = 10 + 12 + 14 + 16 + 18 + 100 = 170
Count = 6
New Mean = 170 / 6 = 28.33
The outlier increased the mean from 14 to 28.33, showing how sensitive the mean is to extreme values.
The mean is particularly sensitive to outliers because it incorporates every value in the dataset. When an extreme value is added, it significantly increases the sum, which in turn increases the mean. This sensitivity is both a strength (it reflects all data) and a weakness (it can be misleading) of the mean as a measure of central tendency.
Outlier: A data point that is significantly different from other values
Sensitivity: How much a statistic changes when data is altered
Central Tendency: A measure representing the center of a dataset
• Mean incorporates all values equally
• Outliers can dramatically affect the mean
• Mean may not represent typical values in skewed distributions
• Always examine data for outliers before calculating mean
• Consider using median for datasets with extreme values
• Visualize data to identify potential outliers
• Not considering the impact of outliers
• Using mean when median would be more appropriate
• Failing to verify data quality before calculation
A teacher recorded the test scores of 5 students: 85, 90, 78, 92, and 88. What is the average score? If the teacher wants the class average to be 90, what score would the next student need to achieve?
Step 1: Calculate current average
Sum = 85 + 90 + 78 + 92 + 88 = 433
Current count = 5
Current average = 433 / 5 = 86.6
Step 2: Find required score for new average
Desired average = 90
New count = 6
Total needed = 90 × 6 = 540
Required score = 540 - 433 = 107
The current average is 86.6, and the next student would need to score 107 to achieve a class average of 90.
This problem demonstrates how the mean can be used to predict future outcomes. To maintain a desired average with additional data points, we work backwards from the target mean. This approach is commonly used in business forecasting, academic planning, and performance management.
Average: Another term for mean
Test Score: A quantitative measure of performance
Performance Target: A desired outcome or benchmark
• Mean = Total sum ÷ Number of values
• Total sum = Mean × Number of values
• Required value = New total - Current total
• Always check if required values are realistic
• Work backwards from the target when planning
• Consider constraints when setting targets
• Forgetting to account for the additional data point
• Not verifying if the required score is achievable
• Confusing the order of operations in reverse calculations
A student's final grade is calculated with the following weights: Homework (20%), Midterm Exam (30%), Final Exam (50%). If the student scored 85 on homework, 78 on the midterm, and 92 on the final, what is their weighted average?
Weighted mean = (Score₁ × Weight₁) + (Score₂ × Weight₂) + (Score₃ × Weight₃)
Homework contribution: 85 × 0.20 = 17
Midterm contribution: 78 × 0.30 = 23.4
Final contribution: 92 × 0.50 = 46
Weighted Average = 17 + 23.4 + 46 = 86.4
The student's weighted average is 86.4.
Weighted means give different importance to different values in a dataset. Unlike regular means where each value contributes equally, weighted means multiply each value by its weight before summing. This is essential in situations where some data points are more significant than others, such as grade calculations, financial indices, or performance evaluations.
Weighted Mean: A mean where each value has a different importance
Weight: A factor indicating the importance of a value
Contribution: The portion of the mean attributed to each value
• Weighted mean = Σ(Value × Weight)
• Weights typically sum to 1 (or 100%)
• Higher weights give more influence to values
• Always convert percentages to decimals
• Verify that weights sum to 1
• Higher-weighted components have greater impact
• Forgetting to convert percentages to decimals
• Not multiplying values by their weights
• Adding values before multiplying by weights
Which of the following statements about the mean is TRUE?
Let's examine each option:
A) False - Mean and median are only equal in symmetric distributions
B) False - Mean is sensitive to outliers
C) True - This is a fundamental property of the mean
D) False - Mean can be negative if values are negative
For option C: If we have values x₁, x₂, ..., xn with mean x̄, then Σ(xi - x̄) = 0
The answer is C) The sum of deviations from the mean is zero.
The sum of deviations from the mean equals zero is a fundamental mathematical property of the mean. This property shows that the mean is the balance point of the distribution - positive and negative deviations cancel out. This characteristic distinguishes the mean from other measures of central tendency and is crucial for understanding variance and standard deviation calculations.
Deviation: The difference between a value and the mean
Balance Point: Where positive and negative deviations cancel out
Symmetric Distribution: Data evenly distributed around the center
• Σ(xi - x̄) = 0 (sum of deviations from mean is zero)
• Mean is affected by all values in dataset
• Mean is not robust to outliers
• Remember mean as the "balancing point" of data
• Use this property when calculating variance
• Consider median for outlier-resistant measure
• Confusing mean with median
• Assuming mean is always robust
• Forgetting mean can be negative
FAQ
Q: Why is the mean considered the "balance point" of a dataset?
A: The mean serves as the "balance point" because the sum of deviations from the mean equals zero. When we calculate the differences between each data point and the mean, positive deviations (values above the mean) exactly cancel out negative deviations (values below the mean). This creates a mathematical equilibrium where the mean represents the center of mass of the distribution. For example, if we have the dataset [1, 3, 5], the mean is 3. The deviations are (1-3)=-2, (3-3)=0, and (5-3)=2. The sum of deviations is -2+0+2=0, demonstrating the balancing effect.
Q: When should I use the mean versus the median as a measure of central tendency?
A: The choice between mean and median depends on your data distribution and goals. Use the mean when your data is symmetrically distributed and you want to incorporate all values equally in your calculation. The mean is optimal for normally distributed data and when further mathematical operations are planned. Use the median when your data contains outliers, is skewed, or when you want a measure that is not influenced by extreme values. The median is particularly valuable for income data, house prices, or any dataset where extreme values could distort the average. For instance, in a neighborhood where most houses cost $200k but one costs $2M, the median would better represent the typical house price than the mean.