Standard Deviation Formula Calculator
Complete statistics guide • Step-by-step solutions
Standard Deviation Formula::
Show the calculator /Simulator\( \sigma = \sqrt{\frac{\sum_{i=1}^{n} (x_i - \mu)^2}{n}} \) (Population Standard Deviation)
\( s = \sqrt{\frac{\sum_{i=1}^{n} (x_i - \bar{x})^2}{n-1}} \) (Sample Standard Deviation)
Standard deviation measures the average distance of data points from the mean. It's the square root of variance and provides a measure of spread in the same units as the original data. A higher standard deviation indicates greater variability, while a lower value suggests data points cluster closely around the mean.
Where:
- \(\sigma\) = population standard deviation
- \(s\) = sample standard deviation
- \(x_i\) = individual data values
- \(\mu\) = population mean
- \(\bar{x}\) = sample mean
- \(n\) = number of values
The standard deviation is the most commonly used measure of variability in statistics. It's fundamental to many statistical tests and models, and provides intuitive insights into data distribution. It's used in finance for risk assessment, quality control for process monitoring, and scientific research for measuring precision.
Dataset Input
Options
Results
| Index | Value | Deviation | Squared Deviation |
|---|
Enter data to see calculation steps.
Additional statistics will appear here.
Standard Deviation Formula Explained
Standard deviation is a statistical measure that quantifies the amount of variation or dispersion in a dataset. It represents the average distance of data points from the mean, expressed in the same units as the original data. A low standard deviation indicates that values tend to be close to the mean, while a high standard deviation indicates that values are spread out over a wider range. It's the square root of variance and provides a more intuitive measure of spread than variance itself.
There are two main standard deviation formulas depending on the data type:
Where:
- \(\sigma\) = population standard deviation
- \(s\) = sample standard deviation
- \(x_i\) = individual data values
- \(\mu\) = population mean
- \(\bar{x}\) = sample mean
- \(n\) = number of values
Key characteristics of standard deviation:
- Same Units as Data: Standard deviation is in original measurement units
- Always Non-Negative: Cannot be negative (zero if all values identical)
- Measures Spread: Larger values indicate greater dispersion
- Affected by Outliers: Extreme values significantly impact standard deviation
- Risk Assessment: Measuring investment volatility
- Quality Control: Monitoring manufacturing consistency
- Statistical Analysis: Confidence intervals and hypothesis testing
- Comparing Groups: Evaluating data spread differences
Standard Deviation Fundamentals
Standard deviation measures the average distance of data points from the mean, providing a measure of spread in the same units as the original data.
\( \sigma = \sqrt{\frac{\sum_{i=1}^{n} (x_i - \mu)^2}{n}} \) (Population)
\( s = \sqrt{\frac{\sum_{i=1}^{n} (x_i - \bar{x})^2}{n-1}} \) (Sample)
Where x = data values, μ = population mean, x̄ = sample mean.
- Square deviations to prevent cancellation
- Sample std dev uses n-1 (Bessel's correction)
- Always non-negative
- Expressed in original data units
Applications
Foundation for confidence intervals, Z-scores, and statistical tests.
- Financial portfolio risk analysis
- Manufacturing process control
- Scientific experiment precision
- Educational assessment reliability
- Interpretation is more intuitive than variance
- Sensitive to outliers
- Sample vs population matters
- Used with mean for complete description
Standard Deviation Formula Learning Quiz
What is the sample standard deviation of the dataset: 2, 4, 6, 8, 10?
Step 1: Calculate the mean
Mean = (2 + 4 + 6 + 8 + 10) / 5 = 30 / 5 = 6
Step 2: Find squared deviations from mean
(2-6)² = (-4)² = 16
(4-6)² = (-2)² = 4
(6-6)² = (0)² = 0
(8-6)² = (2)² = 4
(10-6)² = (4)² = 16
Step 3: Calculate sample variance (divide by n-1)
Sample variance = (16 + 4 + 0 + 4 + 16) / (5-1) = 40 / 4 = 10
Step 4: Calculate sample standard deviation
Sample std dev = √10 = 3.16
The answer is B) 3.16.
The standard deviation calculation builds upon the variance calculation. After finding the mean and squared deviations, we calculate the variance by averaging the squared deviations. Then, to get the standard deviation, we take the square root of the variance. This brings the measure back to the original units of the data, making it more interpretable. The sample standard deviation uses n-1 in the denominator to provide an unbiased estimate of the population standard deviation.
Standard Deviation: Square root of variance, measures spread in original units
Deviation: Difference between a value and the mean
Sample Standard Deviation: Standard deviation calculated from sample data
• Sample std dev uses n-1 in denominator
• Population std dev uses n in denominator
• Standard deviation = √Variance
• Remember to square deviations first, then take square root
• Use n-1 for samples, n for populations
• Standard deviation is in same units as original data
• Taking square root too early in the calculation
• Using n instead of n-1 for sample standard deviation
• Forgetting to square deviations before averaging
Calculate the sample standard deviation of the dataset: 5, 10, 15, 20, 25, and then recalculate after adding an outlier value of 100. Explain how the outlier affects the standard deviation.
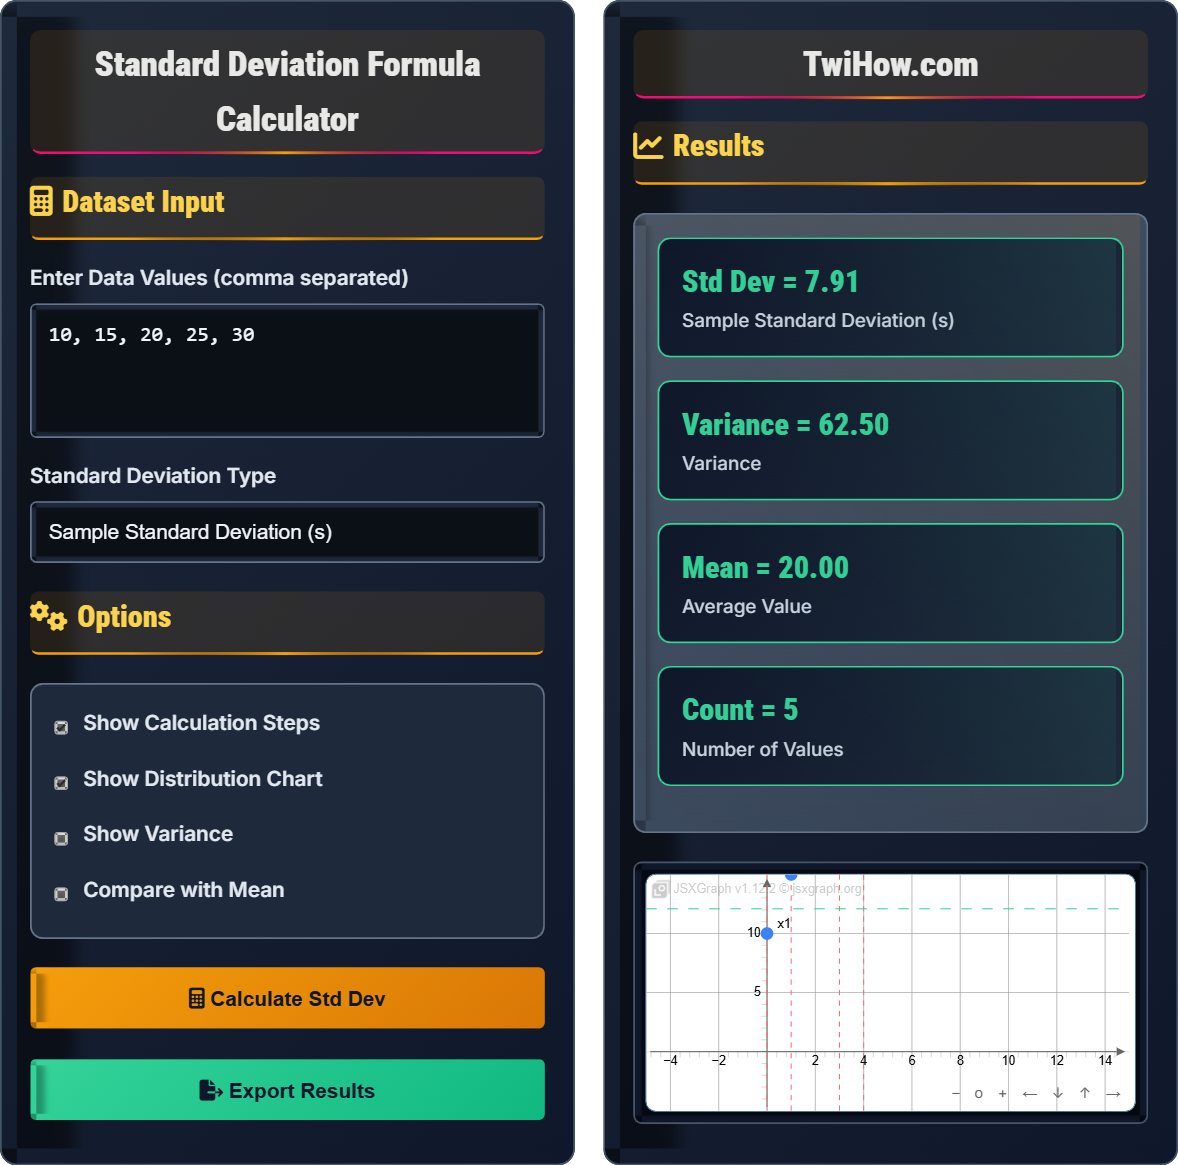
Original dataset: 5, 10, 15, 20, 25
Mean = (5 + 10 + 15 + 20 + 25) / 5 = 75 / 5 = 15
Squared deviations: (5-15)² = 100, (10-15)² = 25, (15-15)² = 0, (20-15)² = 25, (25-15)² = 100
Sample variance = (100 + 25 + 0 + 25 + 100) / (5-1) = 250 / 4 = 62.5
Sample std dev = √62.5 = 7.91
New dataset: 5, 10, 15, 20, 25, 100
New mean = (5 + 10 + 15 + 20 + 25 + 100) / 6 = 175 / 6 = 29.17
Squared deviations: (5-29.17)² = 585.19, (10-29.17)² = 367.47, (15-29.17)² = 200.69, (20-29.17)² = 84.03, (25-29.17)² = 17.36, (100-29.17)² = 5013.79
New sample variance = (585.19 + 367.47 + 200.69 + 84.03 + 17.36 + 5013.79) / (6-1) = 6268.53 / 5 = 1253.71
New sample std dev = √1253.71 = 35.41
The outlier increased the standard deviation from 7.91 to 35.41, demonstrating how sensitive standard deviation is to extreme values.
Standard deviation is highly sensitive to outliers because it involves squaring the deviations from the mean. When an outlier is present, its squared deviation becomes extremely large, disproportionately affecting the overall standard deviation. This is why standard deviation (like variance) may not be the best measure of spread for datasets with significant outliers. The squaring amplifies the impact of extreme values, making standard deviation less robust compared to other measures like the interquartile range.
Outlier: A data point significantly different from others
Sensitivity: How much a statistic changes with data alterations
Robustness: Resistance to effects of outliers
• Standard deviation squares deviations, amplifying outliers
• Highly sensitive to extreme values
• May not represent typical data spread with outliers
• Always check for outliers before calculating standard deviation
• Consider alternative measures for outlier-prone data
• Use standard deviation with caution in skewed distributions
• Not accounting for the impact of outliers
• Using standard deviation when IQR would be more appropriate
• Assuming standard deviation always represents typical spread
A quality control manager measured the diameters (in mm) of 5 bolts: 10.2, 10.1, 10.3, 10.2, 10.2. Calculate the sample standard deviation and explain what this tells the manager about the consistency of the manufacturing process.
Step 1: Calculate the mean
Mean = (10.2 + 10.1 + 10.3 + 10.2 + 10.2) / 5 = 51.0 / 5 = 10.2 mm
Step 2: Find squared deviations from mean
(10.2-10.2)² = 0² = 0
(10.1-10.2)² = (-0.1)² = 0.01
(10.3-10.2)² = (0.1)² = 0.01
(10.2-10.2)² = 0² = 0
(10.2-10.2)² = 0² = 0
Step 3: Calculate sample variance
Sample variance = (0 + 0.01 + 0.01 + 0 + 0) / (5-1) = 0.02 / 4 = 0.005 mm²
Step 4: Calculate sample standard deviation
Sample std dev = √0.005 = 0.071 mm
The standard deviation of 0.071 mm indicates excellent consistency in the manufacturing process. The very low standard deviation suggests that bolt diameters are very close to the target value of 10.2 mm, with little variation between individual measurements.
In quality control, standard deviation is a critical measure for assessing consistency. A low standard deviation indicates that products are being manufactured with little variation from the target specification, which is desirable for maintaining quality standards. In this example, the very small standard deviation suggests that the manufacturing process is well-controlled and producing consistent results. Quality managers often use standard deviation in conjunction with other statistical process control tools to monitor and improve manufacturing processes.
Quality Control: Process of ensuring product consistency
Manufacturing Process: Series of steps to produce goods
Process Variation: Differences in product characteristics
• Low standard deviation indicates high consistency
• Standard deviation is fundamental to quality metrics
• Used in statistical process control
• Use standard deviation to monitor manufacturing consistency
• Track standard deviation over time for trend analysis
• Compare standard deviation against acceptable tolerance limits
• Not understanding standard deviation units (same as original)
• Confusing sample and population standard deviation in QC
• Ignoring the relationship between standard deviation and quality
If the variance of a dataset is 144, what is the standard deviation? Explain the relationship between variance and standard deviation and why both measures are important.
Standard deviation = √Variance = √144 = 12
The standard deviation is the square root of the variance. Both measures quantify the spread of data around the mean, but they differ in their units and interpretation:
• Variance is in squared units of the original data (e.g., mm², kg²)
• Standard deviation is in the same units as the original data (e.g., mm, kg)
• Variance is mathematically more convenient for statistical formulas
• Standard deviation is more intuitive for interpretation since it's in original units
Both measures are important because variance is used in many statistical calculations and formulas, while standard deviation provides a more interpretable measure of spread that can be directly compared to the original data values.
The relationship between variance and standard deviation is fundamental in statistics. Variance is calculated first because it's mathematically convenient (it's additive for independent random variables), but its squared units make it difficult to interpret directly. Standard deviation solves this interpretation problem by returning the measure to the original units of the data. Both are used in different contexts: variance in theoretical statistics and formulas, and standard deviation in practical applications and reporting.
Standard Deviation: Square root of variance
Units: Measurement scales for data
Interpretability: Ease of understanding statistical measures
• Standard deviation = √Variance
• Variance in squared units, std dev in original units
• Both measure data spread
• Use standard deviation for interpretation
• Use variance for statistical calculations
• Remember the unit differences
• Confusing variance with standard deviation
• Not understanding the unit differences
• Using the wrong measure for interpretation
Which of the following statements about standard deviation is TRUE?
Let's examine each option:
A) False - Standard deviation is always non-negative because it's the square root of variance (which is non-negative)
B) False - Standard deviation is in the same units as the original data (variance is in squared units)
C) True - Since standard deviation is the square root of variance, and variance is always non-negative, standard deviation is always non-negative
D) False - Sample standard deviation uses n-1 (Bessel's correction) in the denominator
Standard deviation is calculated as the square root of variance. Since variance is always non-negative (it's an average of squared deviations), the standard deviation is always non-negative. The only time standard deviation equals zero is when all values in the dataset are identical.
The answer is C) Standard deviation is always non-negative.
The non-negativity of standard deviation is a direct consequence of its definition as the square root of variance. Since variance is calculated as the average of squared deviations from the mean (and squares are always non-negative), variance is always non-negative. Taking the square root of a non-negative number yields another non-negative number. This mathematical property ensures that standard deviation is always zero or positive. A standard deviation of zero occurs only when there is no variation in the data (all values are identical).
Non-negative: Greater than or equal to zero
Squared Deviations: Deviations multiplied by themselves
Bessel's Correction: Using n-1 for sample standard deviation
• Standard deviation ≥ 0 always
• Standard deviation = 0 only if all values identical
• Sample standard deviation uses n-1 denominator
• Remember standard deviation cannot be negative
• Know the difference between sample and population formulas
• Understand why we square deviations first
• Thinking standard deviation can be negative
• Confusing sample and population denominators
• Forgetting why deviations are squared first
FAQ
Q: Why is standard deviation more useful than variance in practical applications?
A: Standard deviation is more practical than variance because it's expressed in the same units as the original data, making it more interpretable. Variance is in squared units, which can be difficult to understand in the context of the original data. For example, if you're measuring heights in inches, the variance would be in square inches, which is not intuitive. The standard deviation, however, would be in inches, allowing you to directly compare it to the mean and individual data points. This makes standard deviation more useful for describing data spread and making practical decisions based on the data.
Q: How is standard deviation used in finance and risk management?
A: In finance, standard deviation is a key measure of investment risk, often called "volatility." It quantifies how much returns vary from the average return over time. A higher standard deviation indicates greater risk because returns fluctuate more widely. Portfolio managers use standard deviation to assess risk-return trade-offs, calculate Value at Risk (VaR), and optimize asset allocation. The Sharpe ratio, which measures risk-adjusted returns, uses standard deviation in the denominator. In practice, investors often prefer assets with lower standard deviation if returns are similar, as they provide more predictable outcomes.