What are key metrics investors evaluate in startups?
Complete metrics guide • Investor evaluation
Investor Metrics:
Show Metrics AnalyzerInvestors evaluate startups using specific metrics that indicate business health, growth potential, and risk profile. These metrics help investors determine the value and potential of a startup, guiding their investment decisions. Understanding these metrics is crucial for entrepreneurs seeking funding.
Key metrics fall into several categories: financial performance, user engagement, growth trends, and operational efficiency. Investors look for metrics that demonstrate product-market fit, scalability, and sustainable growth patterns.
Key metric categories:
- Financial: Revenue, burn rate, unit economics, gross margins
- User: Churn rate, customer acquisition cost, lifetime value
- Growth: Monthly growth rate, market expansion, viral coefficient
- Operational: Efficiency ratios, scalability metrics, market share
Modern investors use a combination of quantitative metrics and qualitative factors to evaluate startups, looking for evidence of sustainable competitive advantages and scalable business models.
Business Metrics
Metric Analysis
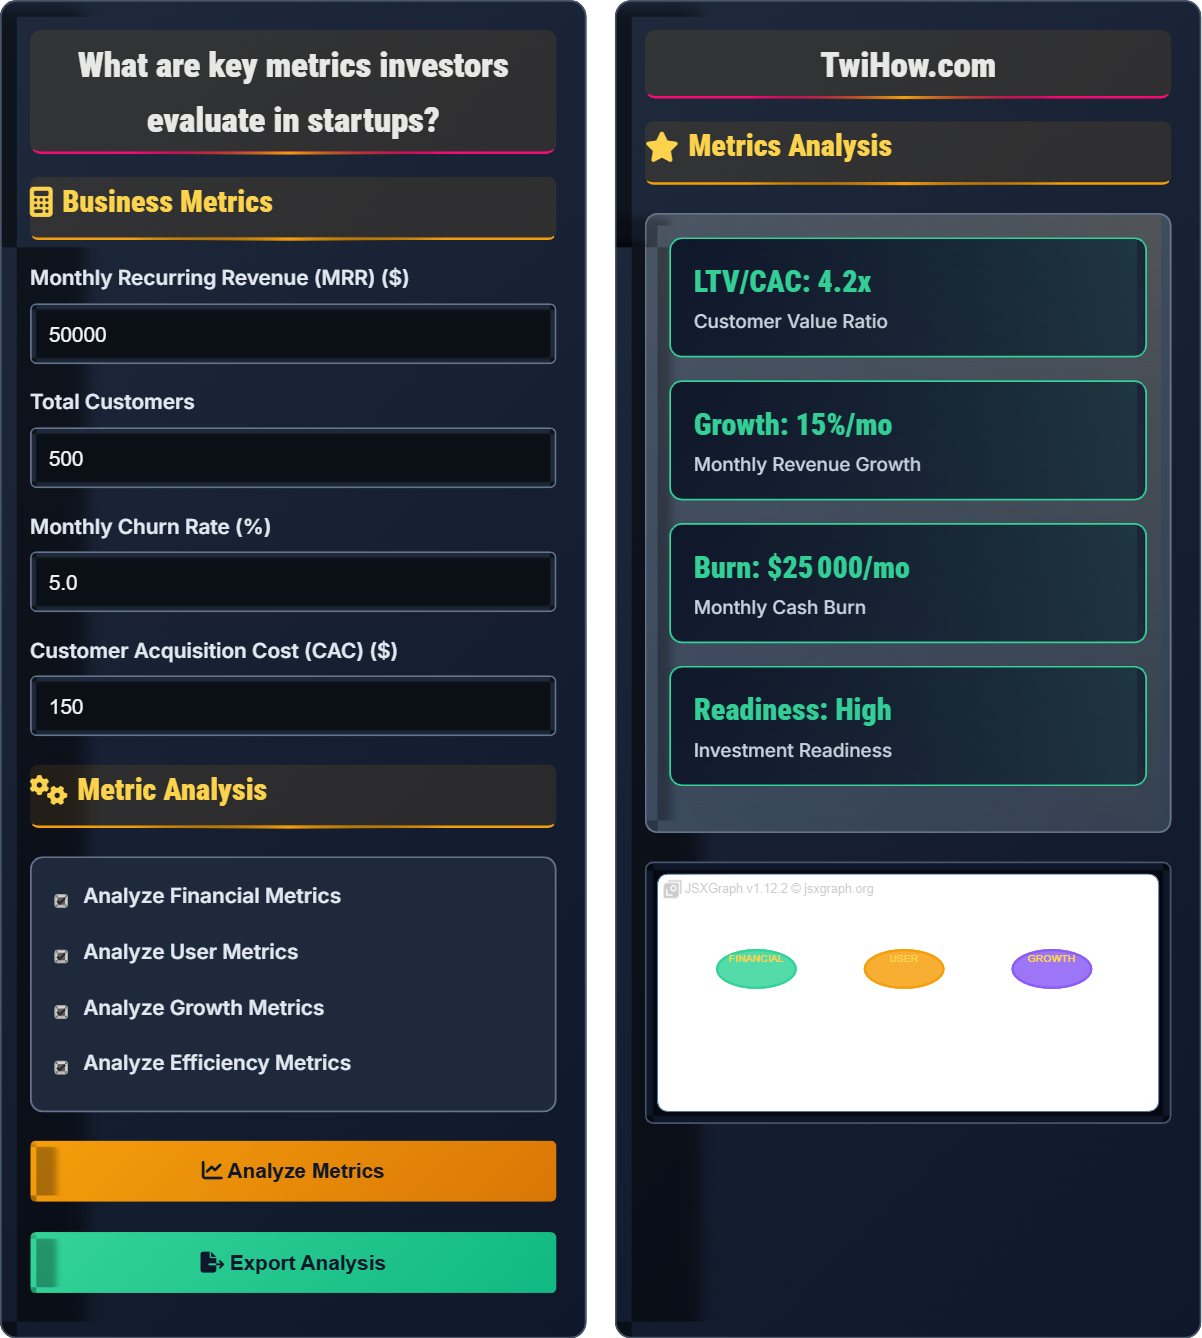
Metrics Analysis
| Metric | Value | Industry Benchmark | Assessment |
|---|---|---|---|
| MRR | $50,000 | $25K-100K | Strong |
| Gross Margin | 85% | 70%-90% | Excellent |
| Burn Rate | $25,000 | $20K-50K | Controlled |
| Runway | 12 months | 6-18 months | Healthy |
| Growth Metric | Current | Target | Strategy |
|---|---|---|---|
| Monthly Growth | 15% | 10-20% | On Track |
| Customer Acquisition | 75/mo | 50-100/mo | Strong |
| Revenue Growth | 15% | 10-25% | Healthy |
| Market Expansion | 2 new | 1-3/mo | Active |
Key Investor Metrics for Startups
Investor metrics are quantitative measures that investors use to evaluate a startup's performance, growth potential, and investment risk. These metrics provide objective insights into business health and help investors compare opportunities across different sectors and stages.
Key investor metrics formula:
Where:
- Financial Health: Revenue growth, margins, cash flow
- Growth Rate: User growth, revenue growth, market expansion
- Unit Economics: LTV/CAC ratio, gross margins, payback period
- Market Opportunity: Total addressable market and growth potential
Startups with strong metrics that attracted investors:
- Slack: High growth rate, low churn, strong network effects
- Stripe: Clean unit economics, high gross margins, increasing market share
- Zoom: Viral coefficient >1, low customer acquisition cost, high retention
- Shopify: Recurring revenue model, expanding market, efficient growth
- Track Everything: Implement comprehensive analytics and reporting
- Focus on Unit Economics: Understand the cost and value of each customer
- Monitor Trends: Look for consistent improvement patterns
- Compare to Benchmarks: Understand industry standards and expectations
- Prepare Narratives: Be able to explain metric changes and trends
Investor Metrics Fundamentals
Key Performance Indicators (KPIs), financial metrics, growth metrics, unit economics, market metrics, investment readiness.
Investment Score = (Financial Health + Growth Rate + Unit Economics) / 3 × Market Opportunity
Where Investment Score = overall attractiveness, Financial Health = revenue and margins, Growth Rate = expansion velocity.
- Track metrics consistently
- Focus on actionable metrics
- Understand industry benchmarks
Applications
Seed stage, Series A, growth stage, SaaS companies, marketplace businesses, hardware startups.
- Identify relevant metrics for your business model
- Set up tracking systems
- Establish baseline measurements
- Monitor trends and patterns
- Prepare for investor presentations
- Business model type
- Stage of development
- Market conditions
- Investor type and preferences
Investor Metrics Learning Quiz
What LTV/CAC ratio is generally considered healthy for SaaS startups?
The correct answer is C) 3:1 or higher. The LTV/CAC ratio measures how much value a customer brings compared to the cost of acquiring them. A ratio of 3:1 or higher indicates that the business generates at least three times the value of acquisition cost, providing a healthy margin for growth and profitability. Ratios below 3:1 suggest inefficient customer acquisition, while ratios above 5:1 indicate excellent unit economics.
Investors look for sustainable LTV/CAC ratios that allow for continued growth while maintaining profitability.
The LTV/CAC ratio is one of the most important metrics for subscription-based businesses. It directly measures the return on customer acquisition investment. A 3:1 ratio means that for every dollar spent on acquiring a customer, the business expects to earn three dollars in revenue over the customer's lifetime. This provides a buffer for operational costs and reinvestment. Understanding this metric helps entrepreneurs optimize their customer acquisition strategies and demonstrates to investors that the business model is sustainable.
LTV: Customer Lifetime Value
CAC: Customer Acquisition Cost
Unit Economics: Cost and revenue per customer
• Maintain 3:1 or higher ratio
• Monitor trends over time
• Account for all acquisition costs
• Include all marketing costs in CAC
• Calculate LTV accurately with churn rates
• Segment by acquisition channel
• Not including all acquisition costs
• Using inaccurate churn rates
• Not segmenting by channel
Explain why Monthly Recurring Revenue (MRR) is a critical metric for investors and how it differs from traditional revenue metrics.
Importance of MRR: MRR provides predictable, recurring revenue that allows for accurate forecasting and growth projections. Investors prefer MRR because it indicates customer commitment and business stability.
Differences from Traditional Revenue:
Predictability: MRR represents committed revenue for the upcoming month, while traditional revenue includes one-time purchases that may not repeat.
Forecasting: MRR enables accurate revenue projections based on customer count and churn rates.
Valuation Impact: Recurring revenue businesses typically receive higher valuations due to predictability.
Growth Measurement: MRR growth reflects both customer acquisition and retention, providing a complete picture of business health.
Investment Decisions: MRR helps investors assess the sustainability and scalability of the business model.
MRR is fundamental to SaaS and subscription business models because it represents the recurring nature of the revenue stream. Unlike traditional businesses where revenue can vary significantly month-to-month, MRR provides visibility into the business's future performance. This predictability is crucial for investors who need to assess risk and potential returns. The recurring nature also allows for better resource planning and growth strategy development.
MRR: Monthly Recurring Revenue
Recurring Revenue: Revenue that repeats regularly
Revenue Predictability: Ability to forecast future revenue
• Track MRR growth consistently
• Monitor churn rates
• Segment by customer type
• Calculate net MRR (include upgrades/downgrades)
• Track MRR by cohort
• Monitor expansion MRR
• Including one-time fees in MRR
• Not tracking MRR churn separately
• Not segmenting customer growth
Your SaaS startup has 1,000 customers and loses 50 customers per month. Your average customer pays $100/month. Calculate the monthly churn rate, annual churn rate, and customer lifetime. How does this impact investor perception?
Monthly Churn Rate: (50 lost customers / 1,000 total customers) × 100 = 5%
Annual Churn Rate: 1 - (1 - 0.05)^12 = 46% (approximately)
Customer Lifetime: 1 / 0.05 = 20 months
Annual Revenue Churn: 5% × $100 × 12 months = $60 per customer annually
Impact on Investors: A 5% monthly churn rate is concerning for investors as it's quite high. This suggests potential issues with product-market fit, customer satisfaction, or competitive pressures. Investors would want to understand the causes and see plans to reduce churn. High churn significantly impacts growth and profitability projections.
This calculation demonstrates the exponential nature of churn. While 5% monthly churn might seem modest, it compounds to nearly 50% annual churn, meaning half the customer base is replaced each year. This creates significant pressure on customer acquisition and affects unit economics. Investors prefer monthly churn rates below 3% for established SaaS companies. Understanding these calculations helps entrepreneurs assess their business health and prepare for investor questions about retention.
Churn Rate: Percentage of customers lost per period
Customer Lifetime: Average time a customer stays
Revenue Churn: Percentage of revenue lost per period
• Aim for monthly churn < 3%
• Calculate both customer and revenue churn
• Segment churn by customer type
• Track churn by cohort
• Identify churn patterns
• Implement retention strategies
• Not distinguishing between customer and revenue churn
• Ignoring seasonal patterns
• Not segmenting by customer value
Your startup has $500,000 in the bank, monthly expenses of $40,000, and monthly revenue of $15,000. Calculate your burn rate and runway. What should you communicate to investors about these metrics?
Monthly Burn Rate: $40,000 (expenses) - $15,000 (revenue) = $25,000 per month
Cash Runway: $500,000 (cash) ÷ $25,000 (burn rate) = 20 months
Investor Communication:
1) Current Status: 20 months of runway provides stability for execution
2) Improvement Plan: Strategies to reduce burn rate or accelerate revenue growth
3) Milestones: How the runway will be used to achieve key metrics
4) Funding Timeline: When additional funding will be sought
5) Risk Mitigation: Plans if runway needs to be extended
With 20 months of runway, the startup has time to execute its growth plan and reach key milestones before needing additional funding.
Burn rate and runway are critical for investor assessment of financial management and planning. A 20-month runway is generally acceptable for early-stage companies, giving them time to achieve growth milestones. However, investors want to see a clear plan for using this time effectively. The key is demonstrating that the runway is sufficient to reach the next funding milestone while maintaining operational discipline. Investors also look for evidence that the startup is actively working to reduce burn rate and increase revenue.
Burn Rate: Monthly cash consumption
Cash Runway: Time before running out of cash
Operational Discipline: Efficient resource management
• Maintain 12-18 months minimum runway
• Communicate burn rate trends
• Plan for milestone achievement
• Calculate weekly burn rate
• Plan funding rounds in advance
• Optimize spending regularly
• Not tracking burn rate weekly
• Failing to plan funding timing
• Ignoring efficiency metrics
Why is gross margin particularly important for SaaS startups?
The correct answer is B) It shows scalability potential and unit economics. Gross margin is crucial for SaaS startups because it represents the percentage of revenue available to cover operating expenses and generate profit after direct costs. High gross margins (typically 70-90% for SaaS) indicate that the business model is scalable - as revenue grows, the incremental costs are relatively small, leading to expanding profitability.
Investors look for high gross margins as they indicate the potential for strong unit economics and sustainable growth.
Gross margin is a fundamental metric that reflects the inherent profitability of a business model. For SaaS companies, high gross margins are possible because the marginal cost of serving additional customers is relatively low once the software is developed. This scalability is what makes SaaS attractive to investors. High gross margins mean that growth in revenue translates directly to growth in profitability, making the business more valuable. Understanding this relationship helps entrepreneurs focus on metrics that drive long-term value creation.
Gross Margin: Revenue minus direct costs
Scalability: Ability to grow efficiently
Unit Economics: Profitability per customer unit
• Aim for 70%+ gross margins
• Monitor margin trends
• Understand cost drivers
• Track gross margin by customer segment
• Monitor impact of pricing changes
• Understand cost structure
• Not tracking margin trends
• Ignoring cost of goods sold
• Not segmenting by product/service
FAQ
Q: How should I prioritize which metrics to focus on at different stages of my startup?
A: At early stages (seed/pre-product), focus on product-market fit metrics: user engagement, retention, early revenue signs, and customer feedback. At growth stage (Series A/B), emphasize growth metrics: MRR growth, customer acquisition, churn rate, and unit economics. At scale stage (Series C+), focus on efficiency metrics: gross margins, sales efficiency, market share, and profitability pathways. The key is aligning metrics with your current objectives. Seed investors care more about product-market fit than growth metrics, while growth investors prioritize growth and efficiency over early-stage validation metrics. Always present metrics that support your narrative for the funding round you're seeking.
Q: How do investors view different business models differently in terms of metrics?
A: Different business models require different metric approaches. SaaS companies are evaluated primarily on recurring revenue, churn, and unit economics. Marketplace businesses are assessed on take rate, GMV growth, and network effects. E-commerce companies are judged on customer acquisition cost, lifetime value, and inventory turns. Hardware startups are evaluated on manufacturing costs, supply chain efficiency, and unit economics at scale. Ad-supported businesses are measured on user engagement, ad load, and revenue per user. The key is understanding which metrics matter most for your specific model and presenting them in context with industry benchmarks. Investors expect different metrics to be prioritized based on the business model's inherent characteristics and growth patterns.