Evaluating the ROI of Solar Panels for Your Home
Complete guide • Step-by-step explanations
Solar Panel ROI:
Show ROI CalculatorEvaluating the return on investment (ROI) for solar panels involves analyzing the upfront costs, projected savings, tax incentives, and long-term financial benefits. The ROI depends on factors like your location, electricity usage, system size, financing options, and local utility rates. A comprehensive evaluation considers both financial returns and environmental benefits.
Key evaluation components include:
- Installation Costs: Equipment, labor, permits, and grid connection
- Energy Production: Sunlight exposure, system efficiency, and orientation
- Electricity Savings: Reduced utility bills over system lifetime
- Tax Incentives: Federal tax credits, state rebates, and local incentives
- Property Value: Increase in home value from solar installation
- Payback Period: Time to recover initial investment
Proper ROI evaluation helps determine if solar panels are a financially sound investment for your specific situation and long-term financial goals.
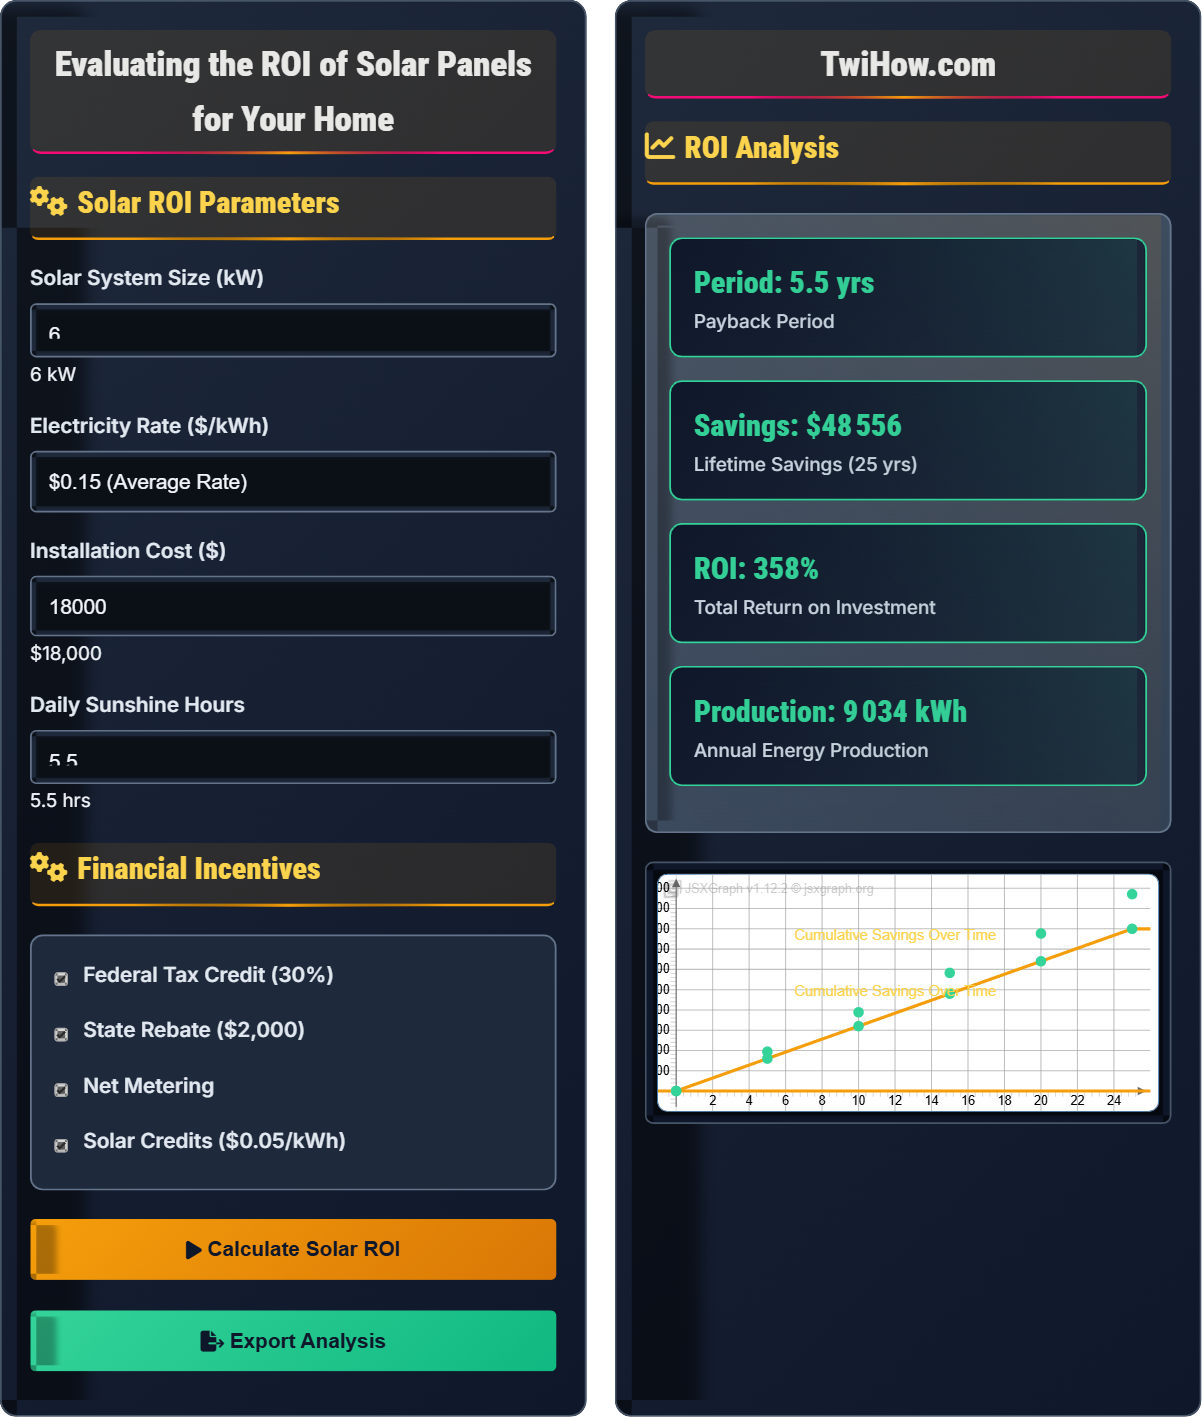
Solar ROI Parameters
Financial Incentives
ROI Analysis
| Year | Energy Production | Bill Savings | Cumulative Savings |
|---|---|---|---|
| 1 | 10,800 kWh | $1,620 | $1,620 |
| 5 | 10,800 kWh | $1,620 | $8,100 |
| 10 | 10,800 kWh | $1,620 | $16,200 |
| 25 | 10,800 kWh | $1,620 | $40,500 |
Solar Panel ROI Evaluation Process
Solar Return on Investment (ROI) is the financial return generated by a solar panel system over its lifetime compared to the initial investment cost. It includes all financial benefits such as electricity bill savings, tax incentives, rebates, and increased property value, minus all costs including installation, maintenance, and financing.
Solar ROI follows a structured calculation:
Where:
- Total Lifetime Savings: All financial benefits over system lifetime
- Net Investment: Initial cost minus all incentives and rebates
- ROI: Percentage return on investment
Key factors affecting solar ROI:
- Electricity Rates: Higher rates improve savings potential
- Sun Exposure: More sunlight increases energy production
- System Size: Optimal size for your energy needs
- Tax Incentives: Federal and state credits reduce costs
- Financing Options: Purchase vs. lease vs. PPA
- Maintenance Costs: Minimal but ongoing expenses
- Payback Period: Time to recover initial investment
- Internal Rate of Return: Annualized return on investment
- Net Present Value: Current value of future cash flows
- Cost per Watt: Installation cost per system capacity
- Energy Payback Time: Time to generate equivalent energy
- Performance Ratio: Actual vs. expected energy production
Fundamentals of Solar ROI Evaluation
Solar ROI, payback period, net metering, federal tax credit, renewable energy, energy independence, solar incentives.
ROI = ((Total Savings - Net Investment) / Net Investment) × 100
Where higher values indicate better investment returns.
- Consider all available incentives
- Account for electricity rate increases
- Factor in system degradation over time
Applications
Residential solar installations, commercial solar projects, solar financing decisions, investment comparisons.
- Homeowner investment decisions
- Financing options evaluation
- System size optimization
- Property value assessment
- Tax planning strategies
- Local utility policies
- Climate and sun exposure
- Roof condition and orientation
Solar ROI Quiz
What is the current federal tax credit for solar installations?
The federal Investment Tax Credit (ITC) currently allows homeowners to deduct 30% of the cost of installing a solar energy system from their federal taxes. This credit applies to both residential and commercial systems and has been extended through 2032.
The answer is B) 30% of system cost.
The federal solar tax credit is one of the most significant incentives for solar adoption. It directly reduces your tax liability by 30% of the solar system cost. For example, if your system costs $20,000, you can claim a $6,000 tax credit. This significantly improves the ROI of solar installations.
Federal ITC: Investment Tax Credit for solar installations
Tax Credit: Direct reduction in tax liability
ROI Impact: Immediate reduction in investment cost
• Tax credit reduces actual investment cost
• Applies to both residential and commercial
• Expires and renews periodically
• Verify current credit percentage before installation
• Consider timing to maximize benefits
• Consult tax professional for claiming
• Not accounting for tax credit in ROI calculations
• Forgetting to claim the credit
• Misunderstanding credit expiration
Calculate the payback period for a $20,000 solar system that saves $1,800 per year after a 30% federal tax credit.
Calculation:
• System cost: $20,000
• Federal tax credit: $20,000 × 0.30 = $6,000
• Net investment: $20,000 - $6,000 = $14,000
• Annual savings: $1,800
• Payback period: $14,000 ÷ $1,800 = 7.78 years
Additional Benefits: After payback, the system continues to provide free electricity for 15-20 more years, generating significant additional savings.
ROI Calculation: Over 25-year lifetime: ($1,800 × 25) - $14,000 = $31,000 profit, or 221% ROI.
The payback period is a simple but important metric for solar ROI. It tells you how long until you've recovered your investment. However, it doesn't account for the value of continued savings after payback. A 7-8 year payback is generally considered good for solar installations, especially given the 25+ year system lifetime.
Payback Period: Time to recover initial investment
Net Investment: Cost after all incentives
System Lifetime: Expected operational period (25+ years)
• Consider entire system lifetime
• Account for all incentives
• Factor in maintenance costs
• Include electricity rate increases in projections
• Consider net metering benefits
• Factor in property value increases
• Not accounting for tax credits
• Ignoring electricity rate increases
• Forgetting maintenance costs
Your solar system produces 12,000 kWh annually but your home only uses 10,000 kWh. If your utility pays $0.12/kWh for excess power through net metering, calculate the additional annual savings. Assume your electricity rate is $0.15/kWh and you have a 6kW system costing $18,000.
Net Metering Calculation:
• Excess production: 12,000 - 10,000 = 2,000 kWh
• Net metering credit: 2,000 kWh × $0.12/kWh = $240
Energy Savings:
• Electricity savings: 10,000 kWh × $0.15/kWh = $1,500
• Total annual savings: $1,500 + $240 = $1,740
With 30% federal tax credit:
• Net system cost: $18,000 × 0.70 = $12,600
• Payback period: $12,600 ÷ $1,740 = 7.24 years
Result: Net metering adds $240 annually to solar savings, improving ROI.
Net metering allows you to sell excess solar power back to the grid, providing additional income. This is especially valuable if your system produces more than you consume. The credit rate varies by utility, so it's important to understand your local net metering policy when calculating ROI.
Net Metering: Credit for excess solar power sent to grid
Export Tariff: Rate paid for exported energy
Net Annual Usage: Difference between production and consumption
• Net metering policies vary by utility
• Credit rates may differ from retail rates
• Annual true-up may affect credits
• Research your utility's net metering policy
• Consider time-of-use rates
• Optimize system size for your usage
• Assuming all utilities offer net metering
• Not understanding credit rates
• Forgetting annual true-up provisions
Your home uses 1,200 kWh monthly. Your roof gets 5.5 hours of peak sun daily and local electricity costs $0.18/kWh. Calculate the optimal solar system size and estimate the ROI assuming $3.00/watt installed cost and 30% federal tax credit.
Energy Needs Calculation:
• Annual usage: 1,200 kWh/month × 12 months = 14,400 kWh/year
• Required system size: 14,400 kWh ÷ (5.5 sun hours/day × 365 days × 0.75 performance factor) = 9.6 kW
System Cost:
• Gross cost: 9,600 watts × $3.00/watt = $28,800
• Federal tax credit: $28,800 × 0.30 = $8,640
• Net cost: $28,800 - $8,640 = $20,160
Annual Savings:
• Energy savings: 14,400 kWh × $0.18/kWh = $2,592
• Payback period: $20,160 ÷ $2,592 = 7.78 years
• 25-year savings: $2,592 × 25 = $64,800
• Total ROI: ($64,800 - $20,160) ÷ $20,160 = 221%
Proper system sizing is crucial for optimal ROI. The performance factor accounts for real-world conditions like temperature, shading, and inverter efficiency. A well-sized system should meet most of your energy needs without producing excessive excess that can't be utilized.
Performance Factor: Real-world efficiency vs. ideal conditions
Peak Sun Hours: Equivalent hours of full sun intensity
System Sizing: Matching capacity to energy needs
• Size system to match your usage
• Account for performance factors
• Consider future energy needs
• Get multiple quotes for comparison
• Consider future rate increases
• Factor in home energy efficiency
• Oversizing system unnecessarily
• Not accounting for performance factors
• Ignoring future energy needs
What is the typical annual degradation rate for quality solar panels?
Quality solar panels typically degrade at a rate of 0.5% per year, meaning they retain about 87.5% of their original capacity after 25 years. Premium panels may degrade even slower, while lower-quality panels may degrade faster.
The answer is C) 0.5% per year.
Solar panel degradation is an important factor in long-term ROI calculations. While panels continue to generate electricity for 25+ years, their output gradually decreases. This degradation rate affects the total energy production and savings over the system's lifetime, making it crucial for accurate ROI projections.
Panel Degradation: Gradual decrease in power output over time
Performance Warranty: Guarantees minimum output over time
Lifetime Output: Total energy production over system life• Account for degradation in projections
• Check manufacturer warranties
• Consider performance guarantees
• Look for panels with 25-year performance warranties
• Compare degradation rates between manufacturers
• Factor degradation into ROI calculations
• Not accounting for degradation in projections
• Assuming constant output over 25 years
• Ignoring performance warranties
FAQ
Q: How long do solar panels typically last and maintain efficiency?
A: Quality solar panels typically last 25-30 years with minimal maintenance:
Efficiency Degradation: Modern panels lose about 0.5% efficiency annually, retaining ~87% of original output after 25 years
Warranties: Most manufacturers offer 20-25 year performance warranties guaranteeing 80% output after 25 years
Equipment Lifespan: Inverters typically last 10-15 years and may need replacement once during system lifetime
Maintenance: Minimal maintenance required - occasional cleaning and monitoring
This long lifespan makes solar a solid long-term investment with decades of continued savings.
Q: What financing options are available for solar installations?
A: Several financing options exist for solar installations:
Direct Purchase: Own the system outright, receive all benefits including tax credits
Solar Loans: Finance system with competitive interest rates, own from day one
Solar Leases: Lease system, pay for electricity produced, no upfront costs
Power Purchase Agreements (PPA): Pay only for electricity generated at set rate
Home Equity Loans: Use home equity for potentially tax-deductible financing
Each option has different ROI implications - direct purchase typically offers the best returns.