What is the Role of Home Energy Benchmarking and Comparison Tools?
Complete benchmarking guide • Step-by-step comparison process
Home Energy Benchmarking:
Show Benchmarking CalculatorHome energy benchmarking tools provide standardized methods for evaluating and comparing energy performance across homes. These tools use various metrics and comparison methodologies to help homeowners understand how their energy use compares to similar homes and identify improvement opportunities.
Energy benchmarking platforms analyze energy consumption data, building characteristics, and operational factors to generate performance scores and comparative rankings. They enable homeowners to track improvements over time and make informed decisions about efficiency investments.
Key benchmarking metrics include:
- Energy Use Intensity (EUI): Energy per square foot per year
- Energy Star Score: 1-100 rating based on national data
- HERS Index: Numeric rating compared to reference home
- Portfolio Manager: Comprehensive building benchmarking
- Peer Comparison: Percentile ranking among similar homes
- Normalized Consumption: Adjusted for weather and occupancy
Benchmarking tools facilitate data-driven decisions and help prioritize efficiency improvements based on comparative performance.
Benchmarking Parameters
Comparison Options
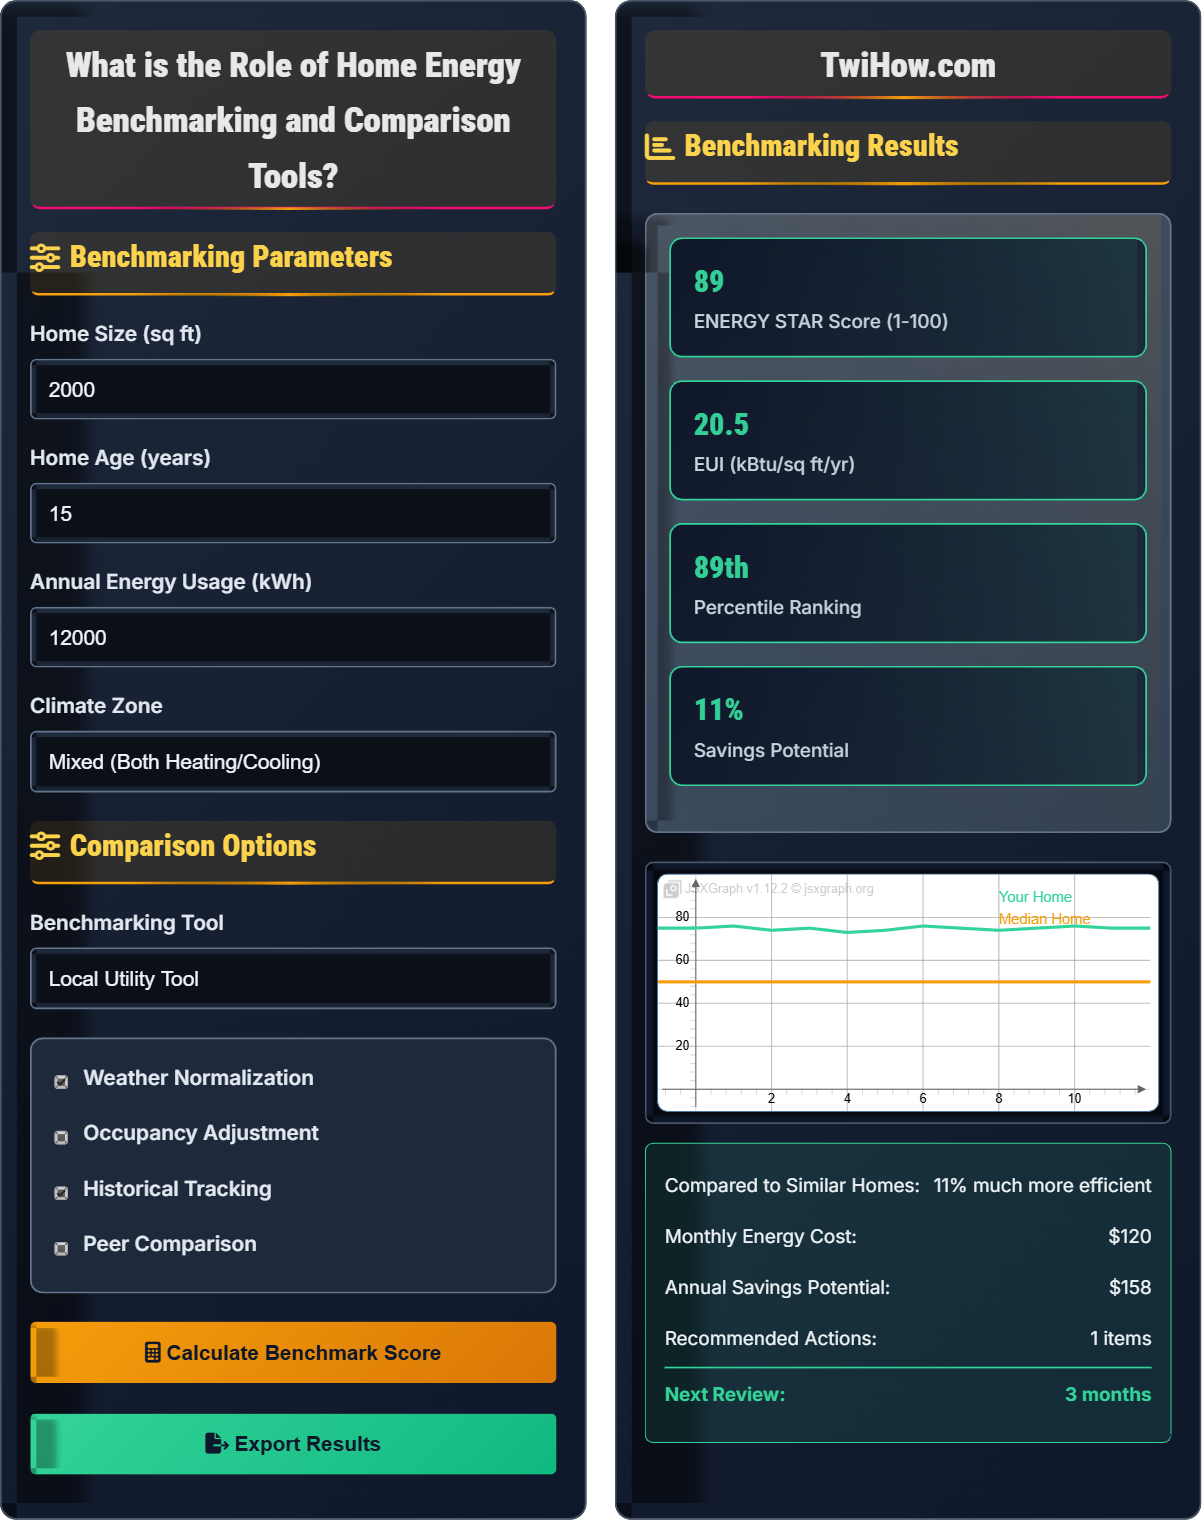
Benchmarking Results
| Metric | Your Home | Median Home | Comparison |
|---|---|---|---|
| Annual Usage | 12,000 kWh | 14,500 kWh | -17% |
| EUI | 60.0 kBtu/sq ft | 72.5 kBtu/sq ft | -17% |
| Monthly Cost | $120 | $145 | -17% |
| SCORE | 75 | 50 | +50% |
- National dataset comparison
- 1-100 scoring system
- Requires detailed inputs
- Standardized rating
- Certified raters
- Requires professional assessment
Understanding Home Energy Benchmarking
Energy benchmarking is the process of measuring and comparing a home's energy performance against standardized metrics, peer groups, or reference buildings. It provides objective measures of energy efficiency and identifies opportunities for improvement relative to similar homes or established standards.
Benchmarking tools use statistical analysis and normalized data to account for variables like climate, occupancy, and building characteristics, enabling fair comparisons between different homes and tracking improvements over time.
Where:
- Reference Performance: Median or standard performance for similar homes
- Actual Performance: Your home's normalized energy use
- Normalization: Adjustment for size, climate, and occupancy
Popular home energy benchmarking tools include:
- ENERGY STAR Portfolio Manager: Comprehensive building benchmarking platform
- Home Energy Yardstick: EPA's residential comparison tool
- HERS Index: Home Energy Rating System scoring
- Local Utility Programs: Regional comparison tools
- Smart Meter Platforms: Utility-provided energy comparison
- Mobile Apps: Consumer energy tracking and comparison
- Performance Tracking: Monitor energy efficiency over time
- Comparative Analysis: See how you compare to similar homes
- Investment Prioritization: Identify highest-impact improvements
- Goal Setting: Establish measurable efficiency targets
- Progress Verification: Track improvement from upgrades
- Market Recognition: Demonstrate efficiency to buyers
Benchmarking Tools
Benchmarking Timeline
Benchmarking Metrics
Home Energy Benchmarking Learning Quiz
What does an ENERGY STAR score of 75 indicate about a home's performance?
An ENERGY STAR score of 75 means the home performs 25% better than the median home (which scores 50). The scale is normalized with 50 representing median performance, so 75 indicates 25% better efficiency.
The answer is B) 25% more efficient than median.
Understanding the ENERGY STAR scoring system is crucial for interpreting benchmarking results. The scale is centered at 50 (median performance), with higher scores indicating better efficiency. A score of 75 means the home performs 25% better than the median home, while a score of 25 would indicate 25% worse performance.
ENERGY STAR Score: 1-100 rating system
Median Performance: Score of 50 represents average
Percent Better: Difference from median
• Score of 50 = median performance
• Higher scores = better efficiency
• Scores are percentile-based
• Aim for scores above 75
• Track score improvements over time
• Compare to similar homes
• Assuming higher numbers are worse
• Not understanding the scale
• Comparing to wrong reference
Calculate the Energy Use Intensity (EUI) for a 2,000 sq ft home that uses 12,000 kWh annually and explain its significance.
EUI Formula:
EUI = (Annual Energy Use in kBtu) ÷ (Building Area in sq ft)
EUI = (12,000 kWh × 3.412 kBtu/kWh) ÷ 2,000 sq ft
EUI = 40,944 kBtu ÷ 2,000 sq ft
EUI = 20.5 kBtu/sq ft/yr
Significance: EUI normalizes energy use by building size, enabling comparison between homes of different sizes. A lower EUI indicates better energy efficiency. For residential buildings, typical EUI ranges from 15-40 kBtu/sq ft/yr.
Interpretation: An EUI of 20.5 is good for a residential building, indicating efficient energy use relative to size.
EUI is a fundamental metric in energy benchmarking that normalizes consumption by building size. This allows fair comparisons between homes of different sizes. The conversion factor of 3.412 converts kWh to kBtu (British Thermal Units), which is the standard unit for EUI calculations.
EUI: Energy Use Intensity
kBtu: Thousand British Thermal Units
Normalization: Adjusting for building size
• Use consistent units
• Normalize by building area
• Compare to similar buildings
• Convert kWh to kBtu using 3.412
• Use gross floor area
• Consider climate adjustments
• Using wrong conversion factor
• Not normalizing by area
• Comparing to wrong building types
A home has an EUI of 25 kBtu/sq ft/yr and ranks in the 75th percentile among similar homes. If the median home in the comparison group has an EUI of 35 kBtu/sq ft/yr, calculate the percentage improvement and explain what the percentile ranking means.
Percentage Improvement:
- Your EUI: 25 kBtu/sq ft/yr
- Median EUI: 35 kBtu/sq ft/yr
- Improvement: (35 - 25) ÷ 35 × 100% = 28.6%
Percentile Ranking: Being in the 75th percentile means the home performs better than 75% of similar homes in the comparison group. Only 25% of homes have better energy performance.
Performance: The home is 28.6% more efficient than the median and performs better than 75% of comparable homes.
Percentile rankings provide intuitive understanding of relative performance. The 75th percentile means you're in the top 25% of performers. The percentage improvement calculation shows the magnitude of the difference from the median, providing both relative and absolute performance measures.
Percentile Ranking: Position relative to comparison group
Median: Middle value of comparison group
Performance Magnitude: Absolute improvement
• Percentile shows relative position
• Calculate absolute improvements
• Compare to appropriate group
• Look for 75th percentile or higher
• Track percentile changes
• Understand comparison groups
• Confusing percentile with percentage
• Not calculating absolute improvements
• Comparing to wrong groups
A home consumed 15,000 kWh in a year with 5,000 HDD (Heating Degree Days), while the local average for similar homes is 14,000 kWh at 4,500 HDD. Normalize the consumption to standard weather conditions and compare the efficiency.
Normalization Formula:
Normalized Consumption = (Actual Consumption ÷ HDD) × Standard HDD
Standard HDD = 4,500 (local average)
Your Home:
Normalized = (15,000 ÷ 5,000) × 4,500 = 13,500 kWh
Local Average:
Normalized = (14,000 ÷ 4,500) × 4,500 = 14,000 kWh
Comparison:
Your normalized consumption (13,500 kWh) is 3.6% lower than the local average (14,000 kWh), indicating better weather-normalized efficiency.
Weather normalization is essential for fair comparisons across different years or locations. By adjusting for weather variations, we can assess true energy efficiency rather than just consumption. This example shows that despite higher actual consumption, the home is actually more efficient when weather differences are accounted for.
HDD: Heating Degree Days
Weather Normalization: Adjusting for climate differences
True Efficiency: Performance independent of weather
• Always normalize for weather
• Use consistent degree day data
• Compare normalized values
• Use local weather data
• Consider both HDD and CDD
• Track weather-normalized trends
• Not normalizing for weather
• Using incorrect degree day data
• Comparing raw consumption only
Which of the following is NOT a primary benefit of home energy benchmarking?
While benchmarking provides valuable insights for energy management, it cannot eliminate all energy use. Buildings require energy for lighting, heating, cooling, and appliances. The purpose of benchmarking is to optimize energy use, not eliminate it entirely.
The answer is D) Elimination of all energy use.
This question tests understanding of realistic expectations from benchmarking. While benchmarking can significantly improve energy efficiency, it's important to understand that buildings will always require some energy. The goal is optimization, not elimination.
Energy Optimization: Most efficient use of energy
Realistic Goals: Achievable efficiency improvements
Benchmarking Purpose: Performance improvement, not elimination
• Set realistic efficiency goals
• Focus on optimization
• Track meaningful metrics
• Set achievable targets
• Focus on major energy users
• Track progress regularly
• Expecting zero energy use
• Not setting realistic goals
• Focusing on minor improvements
FAQ
Q: How often should I benchmark my home's energy performance?
A: For most homeowners, annual benchmarking is sufficient to track performance and identify trends. However, if you've made energy efficiency improvements, benchmarking quarterly can help verify the impact. Smart meter platforms often provide monthly comparisons, which can be useful for tracking seasonal variations.
After major upgrades, benchmarking immediately and then annually thereafter provides the best tracking of improvement impacts.
Q: What data do I need for accurate home energy benchmarking?
A: Essential data for accurate benchmarking includes:
1. Energy Consumption: Monthly electricity, gas, and other fuel usage
2. Building Characteristics: Size, age, number of occupants, construction type
3. Operational Data: Thermostat settings, equipment ages, usage patterns
4. Climate Data: Heating and cooling degree days for your location
5. Improvement History: Dates and types of efficiency upgrades
More detailed data leads to more accurate and meaningful benchmarking results.