What are the best practices for renewable energy monitoring and performance verification?
Complete renewable energy monitoring guide • Best practices & verification
Monitoring & Verification Framework:
Show Monitoring SimulatorBest practices for renewable energy monitoring and performance verification involve systematic data collection, real-time analysis, predictive maintenance, and comprehensive reporting. These practices ensure optimal system performance, early fault detection, and accurate energy yield projections.
Effective monitoring systems utilize IoT sensors, SCADA systems, and cloud-based platforms to collect and analyze operational data. Verification processes compare actual performance against expected values, identifying underperformance and optimizing system efficiency.
Key monitoring components:
- Data Acquisition: Real-time collection of electrical and environmental parameters
- Analytics: Trend analysis, predictive modeling, and performance diagnostics
- Alerting: Automated notifications for anomalies and maintenance needs
- Reporting: Comprehensive performance reports for stakeholders
Verification methodologies include performance ratio calculations, degradation analysis, and energy yield comparisons to ensure systems meet design expectations.
Monitoring Parameters
Monitoring Options
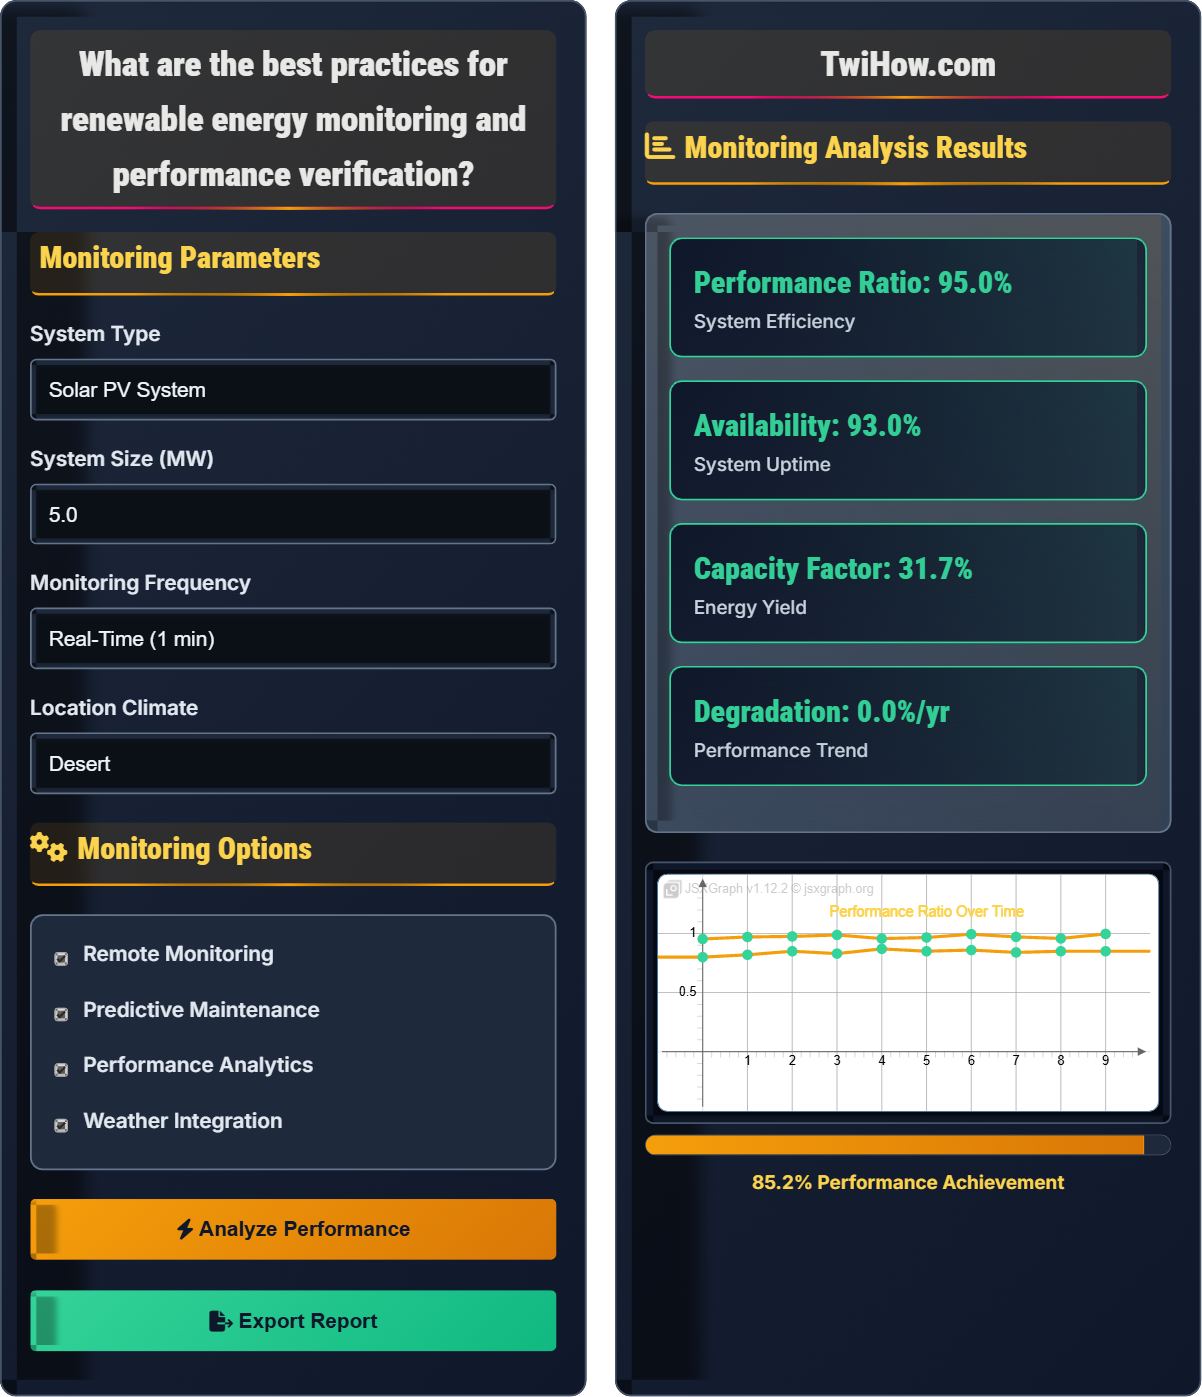
Monitoring Analysis Results
| Parameter | Actual | Expected | Status |
|---|---|---|---|
| DC Power | 4.2 MW | 4.5 MW | Good |
| AC Power | 3.8 MW | 4.0 MW | Fair |
| Irradiance | 850 W/m² | 820 W/m² | Excellent |
| Temperature | 32°C | 35°C | Good |
| Energy Yield | 34.2 MWh | 36.0 MWh | Good |
Monitoring & Performance Verification Best Practices Explained
Renewable energy monitoring involves the systematic collection, analysis, and interpretation of operational data from renewable energy systems. This includes electrical parameters (voltage, current, power), environmental conditions (irradiance, temperature, wind speed), and system health indicators.
Effective monitoring systems follow a structured architecture:
Architecture components:
- Sensors: IoT devices measuring electrical and environmental parameters
- Data Loggers: Collecting and storing measurement data
- Communication: Transmitting data to central systems
- Analytics Platform: Processing and analyzing data
- User Interface: Dashboards and reporting tools
Essential KPIs for renewable energy systems:
- Performance Ratio (PR): Actual vs. theoretical energy output
- Capacity Factor: Actual vs. maximum possible energy output
- System Availability: Percentage of time system is operational
- Energy Yield: Total energy produced per unit of installed capacity
- Degradation Rate: Annual decline in system performance
- Specific Yield: Energy output per unit of installed capacity
- Early Fault Detection: Identifies issues before they cause major problems
- Optimized Maintenance: Schedules maintenance based on actual system condition
- Performance Optimization: Identifies opportunities for efficiency improvements
- Revenue Protection: Ensures maximum energy production and revenue
- Compliance Assurance: Meets regulatory and contractual requirements
Monitoring Metrics & Performance Assessment
- Collect data at appropriate intervals for system type
- Calibrate sensors regularly for accuracy
- Establish baseline performance for comparison
- Implement automated alerting for anomalies
Monitoring Best Practices Framework
Data Flow Architecture
Renewable Energy Monitoring Quiz
What is the correct formula for calculating the Performance Ratio (PR) in renewable energy systems?
The Performance Ratio is calculated as the ratio of actual AC energy produced to the theoretical AC energy that should have been produced under standard test conditions (STC). The formula is: PR = (Actual AC Energy / Theoretical AC Energy) × 100.
The answer is B) PR = (Actual AC Energy / Theoretical AC Energy) × 100.
The Performance Ratio is a standardized metric that allows comparison of system performance regardless of location, orientation, or weather conditions. It normalizes the actual energy output against what would theoretically be produced under ideal conditions, providing a measure of system efficiency independent of environmental factors.
Performance Ratio (PR): Measure of system efficiency independent of environmental conditions
Standard Test Conditions (STC): Reference conditions for performance comparison
Theoretical Energy: Energy that would be produced under ideal conditions
• PR accounts for environmental variations
• Higher PR indicates better system efficiency
• Normalizes performance across different locations
• PR values above 80% indicate good system performance
• Compare PR across similar systems
• Track PR trends over time
• Confusing PR with capacity factor
• Using incorrect baseline for comparison
• Not accounting for system losses in calculation
Explain the recommended monitoring frequencies for different renewable energy system parameters and justify the rationale behind each recommendation.
Real-Time Monitoring (1-5 minutes): Critical electrical parameters (voltage, current, power) for immediate fault detection and rapid response.
Hourly Monitoring: Energy yield, performance ratios, and environmental conditions for daily analysis and trend identification.
Daily Monitoring: Cumulative energy production, system availability, and maintenance needs for operational planning.
Monthly Monitoring: Degradation analysis, performance comparison, and financial reporting for long-term asset management.
The rationale balances data volume with operational needs, ensuring timely responses to issues while managing storage and processing costs.
Monitoring frequency should match the response time required for different types of issues. Critical electrical faults require immediate attention, so high-frequency monitoring is essential. Performance trends develop over longer periods, so less frequent monitoring suffices. The goal is to optimize the balance between data granularity and operational efficiency.
Real-Time Monitoring: Immediate data collection and analysis
Response Time: Duration between issue occurrence and detection
Data Granularity: Level of detail in collected data
• Match frequency to operational response needs
• Balance data volume with storage costs
• Consider system criticality in frequency selection
• Use high frequency for critical parameters
• Aggregate data for long-term analysis
• Optimize frequency based on system size
• Using same frequency for all parameters
• Over-monitoring leading to data overload
• Under-monitoring missing critical issues
A 10 MW solar farm has been operational for one year. The expected annual energy production was 15,000 MWh, but the actual production was 12,750 MWh. The system experienced 24 hours of unplanned downtime. Calculate the performance ratio, availability, and capacity factor. Discuss what these metrics indicate about system performance.
Performance Ratio:
PR = (Actual Energy / Expected Energy) × 100 = (12,750 / 15,000) × 100 = 85%
Availability:
Available Hours = 8,760 - 24 = 8,736 hours
Availability = (Available Hours / Total Hours) × 100 = (8,736 / 8,760) × 100 = 99.7%
Capacity Factor:
CF = (Actual Energy / (Capacity × Hours)) × 100 = (12,750 / (10 × 8,760)) × 100 = 14.5%
Analysis: The 85% PR indicates good system efficiency, the 99.7% availability shows excellent reliability, but the 14.5% capacity factor suggests the site may have suboptimal solar resource or system design.
These three metrics provide different perspectives on system performance. PR isolates system efficiency from environmental factors, availability shows operational reliability, and capacity factor reflects overall energy productivity. Together, they paint a comprehensive picture of system health and performance.
Performance Ratio: Efficiency metric independent of environmental conditions
Availability: Operational time as percentage of total time
Capacity Factor: Actual vs. maximum possible energy output
• PR above 80% indicates good performance
• Availability above 95% is excellent
• Capacity factor varies by technology and location
• Use multiple metrics for comprehensive analysis
• Compare metrics to industry benchmarks
• Track trends over time
• Confusing capacity factor with efficiency
• Not accounting for environmental factors in PR
• Using incorrect time periods in calculations
You're designing a monitoring system for a 50 MW wind farm. Identify the key parameters to monitor, recommend sensor types and placement, and explain how you would configure automated alerts for performance issues.
Key Parameters:
• Wind Speed and Direction: At hub height and multiple elevations
• Power Output: Real-time AC power from each turbine
• Mechanical Parameters: Rotor speed, generator temperature, gearbox vibration
• Environmental: Ambient temperature, humidity, turbulence intensity
Sensor Recommendations:
• Cup anemometers and wind vanes at hub height for wind measurement
• Current transformers and voltage sensors for power monitoring
• Temperature sensors on generator and gearbox
• Accelerometers for vibration monitoring
Automated Alerts:
• Power output below 90% of expected for wind speed
• Generator temperature exceeding safe limits
• Excessive vibration indicating mechanical issues
• Turbine offline for more than 2 hours without scheduled maintenance
Wind farm monitoring requires different parameters than solar systems, focusing on aerodynamic and mechanical performance. The key is monitoring both electrical output and mechanical health to ensure safe, efficient operation. Automated alerts should distinguish between normal operational variations and actual problems.
Hub Height: Height at which wind measurements are taken
Turbulence Intensity: Measure of wind speed fluctuations
Power Curve: Relationship between wind speed and power output
• Monitor both electrical and mechanical parameters
• Account for site-specific wind characteristics
• Configure alerts based on power curve expectations
• Use multiple sensors for redundancy
• Calibrate regularly for accuracy
• Consider seasonal wind pattern variations
• Only monitoring electrical output
• Not considering mechanical wear indicators
• Setting alerts too sensitively causing false alarms
Which of the following is the most effective approach for implementing predictive maintenance in renewable energy systems?
Predictive maintenance involves monitoring equipment condition in real-time and scheduling maintenance based on actual system needs rather than predetermined schedules. This approach optimizes maintenance timing, reduces unnecessary interventions, and prevents unexpected failures.
The answer is C) Monitor equipment condition and schedule maintenance based on actual needs.
Predictive maintenance uses data from monitoring systems to anticipate when equipment will need service. By analyzing trends in temperature, vibration, efficiency, and other parameters, maintenance can be scheduled proactively, maximizing system availability and minimizing maintenance costs.
Predictive Maintenance: Maintenance based on actual equipment condition
Condition Monitoring: Real-time assessment of equipment health
Proactive Maintenance: Action taken before failure occurs
• Base maintenance on actual condition, not time
• Monitor multiple parameters for comprehensive view
• Track trends for early problem detection
• Use machine learning for pattern recognition
• Combine multiple data sources for accuracy
• Regularly update predictive models
• Confusing predictive with preventive maintenance
• Not monitoring enough parameters
• Failing to act on predictive insights
FAQ
Q: What is the difference between monitoring and verification in renewable energy systems?
A: Monitoring and verification serve different but complementary functions:
Monitoring: Continuous collection and analysis of operational data to track system performance in real-time. Focuses on ongoing operations and immediate issues.
Verification: Systematic comparison of actual performance against expected values to confirm system compliance with design specifications. Focuses on validating that the system meets its intended performance goals.
Monitoring provides the data needed for verification, while verification confirms that monitoring data aligns with expectations. Both are essential for optimal system performance.
Q: How does effective monitoring impact the financial performance of renewable energy projects?
A: Effective monitoring significantly impacts financial performance through several mechanisms:
Revenue Protection: Early detection of performance issues prevents revenue losses from underproduction.
Maintenance Optimization: Predictive maintenance reduces repair costs and minimizes downtime.
Asset Value: Well-monitored systems command higher resale values and better financing terms.
Insurance Benefits: Comprehensive monitoring may reduce insurance premiums.
Contract Compliance: Ensures fulfillment of power purchase agreements and incentive programs.
Studies show that effective monitoring can improve project returns by 2-5% annually through these mechanisms.