How to Analyze Stocks?
Complete stock analysis guide • Step-by-step explanations
Stock Analysis Fundamentals:
Show Analysis ToolStock analysis is the process of evaluating a company's stock to determine its investment potential. It involves examining various factors including financial statements, business model, competitive position, management quality, and market conditions. The goal is to determine whether a stock is undervalued, overvalued, or fairly priced, and to assess its potential for future growth. Effective stock analysis combines both quantitative and qualitative methods.
Key stock analysis components:
- Fundamental Analysis: Evaluating company financials and business
- Technical Analysis: Analyzing price patterns and market trends
- Valuation: Determining if stock is fairly priced
- Risk Assessment: Understanding potential downsides
- Industry Analysis: Evaluating sector conditions
- Market Conditions: Considering economic environment
Successful stock analysis requires a systematic approach that combines multiple analytical methods and considers both quantitative metrics and qualitative factors.
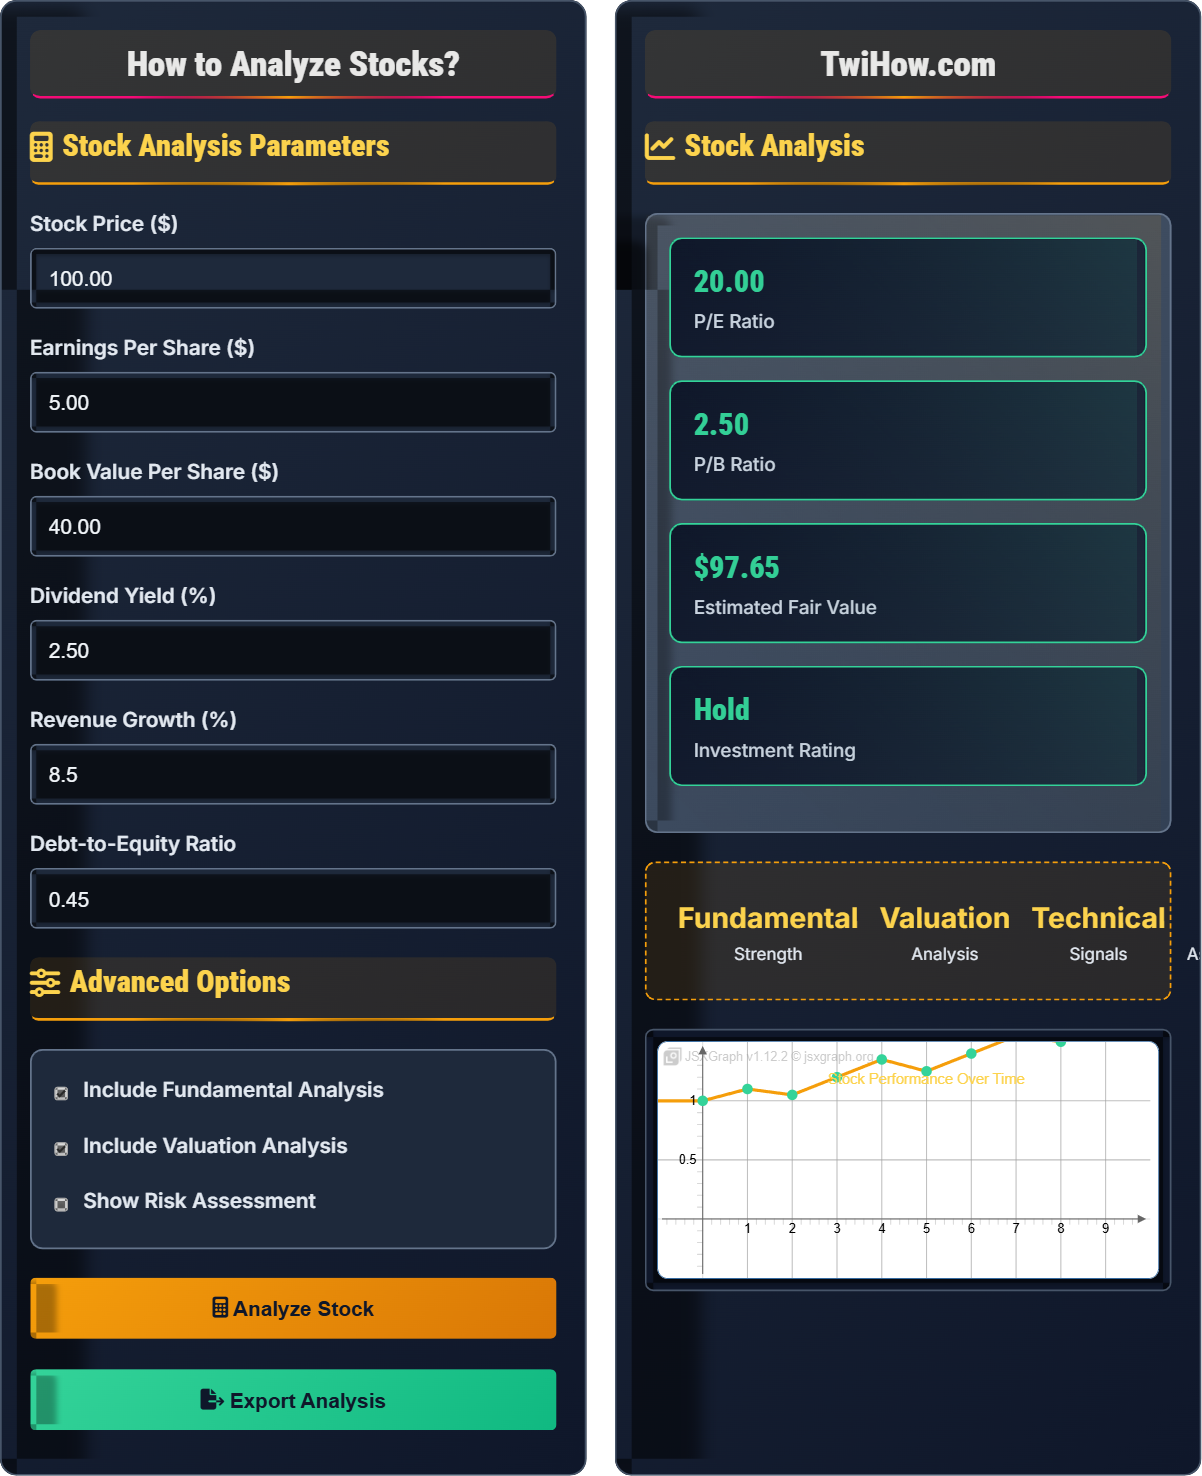
Stock Analysis Parameters
Advanced Options
Stock Analysis
Key concepts for stock analysis:
- Fundamental analysis evaluates business quality
- Technical analysis examines price patterns
- Valuation determines fair price
- Risk assessment identifies potential downsides
- Industry context provides competitive perspective
- Market timing affects entry/exit decisions
| Metric | Value | Industry Avg | Interpretation |
|---|---|---|---|
| P/E Ratio | 20.00 | 22.50 | Better than average |
| P/B Ratio | 2.50 | 3.00 | Reasonably valued |
| Dividend Yield | 2.50% | 1.80% | Above average |
| Debt/Equity | 0.45 | 0.65 | Strong balance sheet |
| Revenue Growth | 8.5% | 6.2% | Outperforming industry |
How Stock Analysis Works
Stock analysis is the process of evaluating a company's stock to determine its investment potential. It involves examining various factors including financial statements, business model, competitive position, management quality, and market conditions. The goal is to determine whether a stock is undervalued, overvalued, or fairly priced, and to assess its potential for future growth.
Where:
- P/E Ratio: Price-to-earnings ratio for valuation
- P/B Ratio: Price-to-book ratio for asset valuation
- ROE: Return on equity for profitability
- Book Value: Company's assets minus liabilities
Popular stock analysis strategies include:
- Value Investing: Finding undervalued stocks based on fundamentals
- Growth Investing: Investing in companies with high growth potential
- Dividend Investing: Focusing on companies that pay regular dividends
- Index Investing: Buying diversified market index funds
- Technical Analysis: Using price patterns and indicators
- Quantitative Analysis: Using mathematical models
- Look Beyond Numbers: Understand the business model and strategy
- Check Management Quality: Evaluate leadership and vision
- Consider Competitive Moats: Sustainable competitive advantages
- Read Annual Reports: Understand company narrative
- Compare Peers: Benchmark against competitors
- Think Long-Term: Focus on sustainable growth
Stock Analysis Fundamentals
Fundamental analysis, technical analysis, valuation, P/E ratio, ROE, debt-to-equity, market capitalization.
P/E Ratio = Price Per Share / Earnings Per Share
P/B Ratio = Price Per Share / Book Value Per Share
ROE = Net Income / Shareholder Equity
Where P/E Ratio indicates valuation relative to earnings.
- Always read financial statements carefully
- Compare metrics to industry averages
- Consider both quantitative and qualitative factors
- Look for sustainable competitive advantages
- Understand the business model thoroughly
Stock Analysis Applications
Investment selection, portfolio management, risk assessment, market timing, fundamental research.
- Research industry and competitive landscape
- Analyze financial statements
- Calculate key ratios
- Assess valuation
- Evaluate management quality
- Make investment decision
- Use multiple analysis methods
- Maintain discipline with criteria
- Regular portfolio reviews
- Adjust for changing conditions
Stock Analysis Tools
Calculate key fundamental metrics to evaluate company health.
Assess whether a stock is overvalued, undervalued, or fairly priced.
Calculate technical indicators to assess price momentum and trends.
Evaluate potential risks associated with the investment.
Analyze historical performance and growth potential.
Stock Analysis Learning Quiz
What does a P/E ratio of 15 mean?
The P/E (Price-to-Earnings) ratio is calculated by dividing the stock price by earnings per share. A P/E ratio of 15 means that investors are willing to pay $15 for every $1 of earnings the company generates. It represents the premium investors are willing to pay for the company's earnings power.
The answer is C) Investors are willing to pay $15 for every $1 of earnings.
The P/E ratio is one of the most commonly used valuation metrics. It essentially tells you how much you're paying for each dollar of a company's earnings. A higher P/E ratio suggests investors expect higher growth in the future, while a lower P/E ratio may indicate the stock is undervalued or the company has slower growth prospects. However, P/E ratios should always be compared within the same industry as different sectors typically trade at different P/E multiples.
P/E Ratio: Price-to-earnings valuation metric
Earnings Per Share: Company earnings divided by shares outstanding
Valuation Metric: Tool to determine if stock is fairly priced
• Compare P/E ratios within same industry
• Consider growth prospects when interpreting
• Use alongside other valuation metrics
• Compare to industry averages
• Consider historical P/E trends
• Factor in growth expectations
• Comparing P/E ratios across different industries
• Using trailing P/E during volatile periods
• Relying solely on P/E ratio
Explain what the debt-to-equity ratio measures, what constitutes a healthy level, and why it's important for stock analysis.
What it measures: The debt-to-equity ratio measures the proportion of debt financing relative to equity financing. It's calculated as Total Debt divided by Total Equity.
Healthy levels: Generally, a debt-to-equity ratio below 0.5 is considered healthy, though this varies by industry. Utilities and financial services may have higher ratios, while tech companies typically have lower ratios.
Importance: This ratio indicates financial leverage and risk. High debt levels increase financial risk and interest expenses, but moderate debt can enhance returns. It helps assess a company's ability to meet its obligations.
The debt-to-equity ratio is a crucial solvency ratio that reveals how a company finances its operations. Companies use both debt and equity to fund their assets, and the optimal mix varies by industry. Too much debt increases financial risk and can lead to bankruptcy during economic downturns. However, debt can also provide tax advantages and enhance returns for shareholders when used prudently. The key is finding the right balance for the specific business model and industry.
Debt-to-Equity: Financial leverage ratio
Solvency: Ability to meet long-term obligations
Financial Leverage: Using debt to increase returns
• Compare to industry peers
• Consider business model and industry norms
• Monitor trend over time
• Look at trend over multiple years
• Consider interest coverage ratio too
• Factor in off-balance-sheet debt
• Not considering industry differences
• Ignoring other leverage metrics
• Focusing only on current ratio
Company XYZ has a net income of $500 million and shareholder equity of $2 billion. What is the company's return on equity (ROE)? If the industry average ROE is 12%, how does this compare? What does this tell you about the company's efficiency in using shareholder funds?
ROE Calculation: ROE = Net Income / Shareholder Equity
ROE = $500 million / $2 billion = 0.25 = 25%
Comparison: Company XYZ's ROE of 25% is significantly higher than the industry average of 12%.
Efficiency: This indicates that Company XYZ is highly efficient at generating profits from shareholder equity. For every dollar of shareholder investment, the company generates 25 cents in profit, which is more than double the industry average. This suggests strong management and profitable business operations.
Return on Equity is one of the most important profitability ratios as it measures how effectively a company uses shareholder funds to generate profits. A high ROE indicates that management is creating substantial value for shareholders. However, it's important to consider the sustainability of high ROE and whether it's driven by high margins, efficient asset utilization, or high financial leverage. An ROE significantly above industry average suggests strong competitive advantages or superior management.
Return on Equity: Profitability ratio measuring efficiency
Shareholder Equity: Assets minus liabilities
Profitability Ratio: Measures profit generation efficiency
• Compare ROE to industry peers
• Look for consistency over time
• Consider sustainability of high ROE
• Analyze ROE trend over 5+ years
• Compare to cost of equity
• Consider quality of earnings
• Not considering how ROE is achieved
• Ignoring debt levels when evaluating ROE
• Looking at only one year of data
You're analyzing a technology company with the following metrics: P/E ratio of 35, debt-to-equity of 0.2, ROE of 18%, revenue growth of 25%, and dividend yield of 0.5%. The industry averages are: P/E of 28, debt-to-equity of 0.5, ROE of 12%, revenue growth of 8%, and dividend yield of 1.2%. How would you evaluate this company using multiple metrics, and what investment recommendation would you make?
Analysis:
• P/E (35 vs 28): Higher than industry, suggesting premium valuation
• Debt-to-Equity (0.2 vs 0.5): Much healthier balance sheet
• ROE (18% vs 12%): Superior profitability
• Revenue Growth (25% vs 8%): Exceptional growth
• Dividend Yield (0.5% vs 1.2%): Lower, typical for growth companies
Recommendation: This appears to be a high-quality growth company trading at a premium. The high P/E is justified by superior growth metrics and profitability. The low debt level provides financial flexibility. Suitable for growth-focused investors willing to pay premium for strong fundamentals.
This example demonstrates the importance of using multiple metrics for comprehensive analysis. No single metric tells the complete story. The high P/E ratio might initially seem concerning, but when viewed alongside exceptional growth rates and profitability, it becomes more understandable. The low debt level provides a safety cushion. This holistic approach prevents misinterpretation of individual metrics and leads to more informed investment decisions.
Growth Company: Focuses on growth over dividends
Multiple Metrics: Using various ratios for analysis
Holistic Analysis: Comprehensive evaluation approach
• Use multiple metrics together
• Consider industry context
• Look for consistency across metrics
• Create scoring system across metrics
• Compare to direct competitors
• Consider business lifecycle stage
• Focusing on single metric
• Not considering industry context
• Ignoring qualitative factors
Which of the following qualitative factors is LEAST important when evaluating a stock for long-term investment?
While all factors except C directly impact the company's ability to generate profits and create shareholder value, office location and parking availability are administrative details that don't significantly affect the business's competitive position or profitability. Management quality, competitive advantages, and business model sustainability are fundamental drivers of long-term success.
The answer is C) Office location and employee parking availability.
While quantitative analysis is crucial, qualitative factors often determine long-term success. Management quality influences strategic decisions and execution. Competitive moats protect profitability from competition. Business model sustainability ensures long-term viability. However, operational details like office location, while important for day-to-day operations, don't fundamentally impact the company's competitive position or ability to generate returns for shareholders.
Qualitative Factors: Non-numerical business characteristics
Competitive Moats: Sustainable competitive advantages
Business Model: How company generates revenue
• Combine quantitative and qualitative analysis
• Focus on factors that drive long-term value
• Consider management's strategic vision
• Listen to earnings calls for management insights
• Read annual reports for strategic direction
• Evaluate competitive positioning
• Focusing only on financial metrics
• Ignoring management quality
• Not considering competitive landscape
FAQ
Q: What are the most important financial ratios to look at when analyzing stocks?
A: Key financial ratios to analyze include:
Valuation Ratios:
• P/E Ratio: Price relative to earnings
• P/B Ratio: Price relative to book value
• EV/EBITDA: Enterprise value to earnings before interest, taxes, depreciation, and amortization
Profitability Ratios:
• ROE: Return on equity
• ROA: Return on assets
• Gross/Operating/Net Profit Margins
Solvency Ratios:
• Debt-to-Equity: Financial leverage
• Current Ratio: Short-term liquidity
• Interest Coverage: Ability to pay interest
Use these ratios in combination and compare to industry peers for meaningful analysis.
Q: How do I know if a stock is a good value?
A: Determining if a stock is a good value involves several approaches:
Fundamental Analysis:
• Compare valuation ratios to historical averages and industry peers
• Evaluate the company's competitive position and growth prospects
• Assess the quality of management and financial health
Qualitative Factors:
• Sustainable competitive advantages (moats)
• Business model resilience
• Market position and brand strength
Quantitative Metrics:
• Free cash flow generation
• Return on invested capital
• Debt levels and balance sheet strength
Remember, value is subjective and depends on your investment timeline and risk tolerance.
Q: Should I focus on growth stocks or value stocks?
A: The choice between growth and value stocks depends on your investment goals and risk tolerance:
Growth Stocks:
• Characteristics: High growth potential, reinvest earnings, typically no dividends
• Pros: Higher potential returns, innovation leaders
• Cons: Higher volatility, expensive valuations
Value Stocks:
• Characteristics: Lower valuations, stable dividends, established companies
• Pros: Lower risk, dividend income, potential for value realization
• Cons: Slower growth, potential for value traps
Many investors benefit from a balanced approach that includes both growth and value stocks based on market conditions and personal objectives.