What are Stocks?
Complete stock market guide • Step-by-step explanations
Stock Market Fundamentals:
Show Stock AnalysisStocks represent ownership shares in a company, giving shareholders a claim on the company's assets and earnings. When you buy a stock, you become a partial owner of that business. Stocks are traded on stock exchanges, and their prices fluctuate based on supply and demand, company performance, economic conditions, and investor sentiment.
Key stock market components:
- Ownership: Representing a fraction of company ownership
- Trading: Buying and selling on exchanges
- Valuation: Determining fair stock prices
- Dividends: Company profit distributions
- Voting Rights: Influence in corporate decisions
- Capital Appreciation: Potential for price increases
Stocks are fundamental to building wealth and diversifying investment portfolios, offering both growth potential and income opportunities.
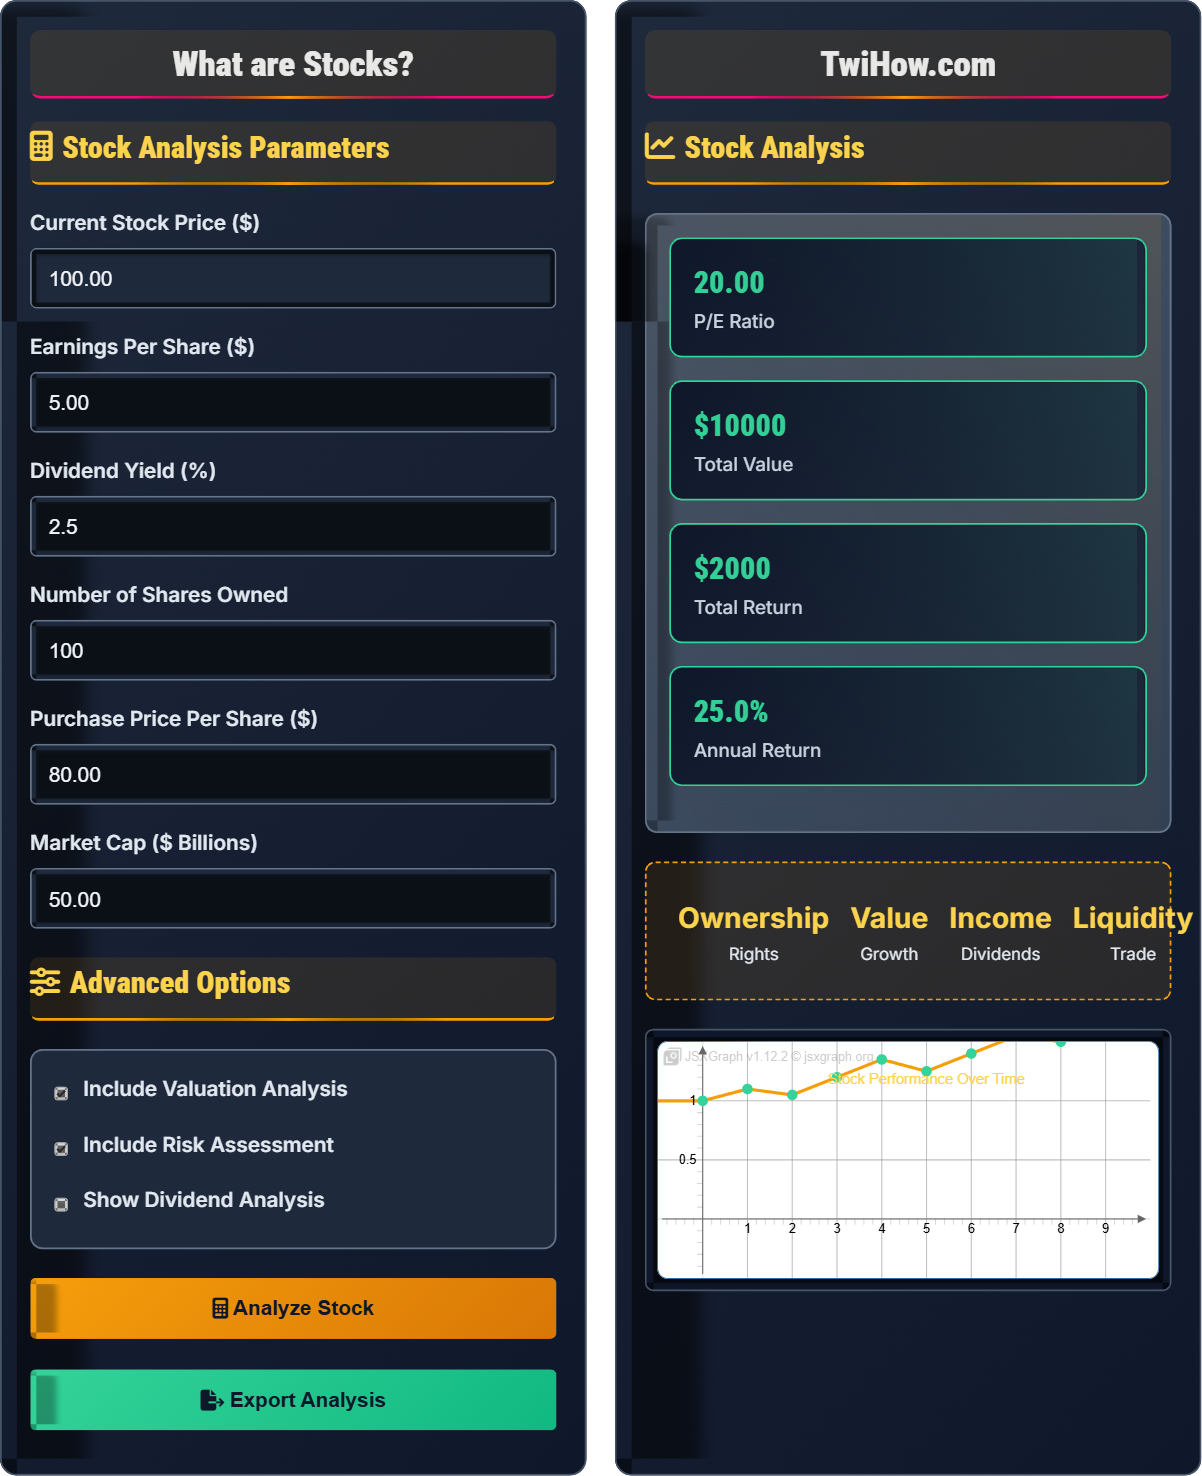
Stock Analysis Parameters
Advanced Options
Stock Analysis
Key concepts to understand about stocks:
- Stocks represent ownership in a company
- Prices fluctuate based on market forces
- Dividends provide income to shareholders
- Capital appreciation offers growth potential
- Diversification reduces investment risk
- Long-term investing typically yields better returns
| Ratio | Value | Interpretation | Significance |
|---|---|---|---|
| P/E Ratio | 20.00 | Moderate valuation | Price relative to earnings |
| Dividend Yield | 2.5% | Moderate income | Annual income relative to price |
| Market Cap | $50B | Large cap | Company size indicator |
| Return | 25.0% | Strong performance | Overall gain since purchase |
| Annualized | 12.5% | Good return | Annual performance measure |
How Stocks Work
Stocks, also known as shares or equities, represent ownership in a corporation. When you buy a stock, you become a shareholder and own a portion of that company proportional to the number of shares you hold. Stocks give investors rights to a portion of the company's assets and earnings, as well as voting rights in major corporate decisions.
Where:
- P/E Ratio: Price-to-earnings ratio for valuation
- EPS: Earnings per share metric
- Dividend Yield: Income return on investment
- Price Per Share: Current market value
Popular stock investment strategies include:
- Value Investing: Finding undervalued stocks based on fundamentals
- Growth Investing: Investing in companies with high growth potential
- Dividend Investing: Focusing on companies that pay regular dividends
- Index Investing: Buying diversified stock market indexes
- Dollar-Cost Averaging: Consistent investment timing regardless of price
- Buy and Hold: Long-term investment approach
- Diversify Holdings: Spread investments across sectors and companies
- Do Your Research: Understand the businesses you're investing in
- Think Long-Term: Focus on company fundamentals over time
- Control Emotions: Avoid panic selling during market volatility
- Reinvest Dividends: Compound returns through dividend reinvestment
- Regular Review: Assess and adjust your portfolio periodically
Stock Market Fundamentals
Equity, shares, stock market, dividends, P/E ratio, market capitalization, stock exchanges.
P/E Ratio = Price Per Share / Earnings Per Share
Dividend Yield = (Annual Dividends Per Share / Price Per Share) × 100%
Where P/E Ratio indicates valuation relative to earnings.
- Understand the business before investing
- Diversify your stock portfolio
- Invest only what you can afford to lose
- Focus on long-term growth
- Control emotional reactions to market volatility
Stock Investment Applications
Wealth building, retirement planning, income generation, portfolio diversification, inflation hedge.
- Open brokerage account
- Research investment options
- Start with diversified index funds
- Gradually add individual stocks
- Set up automatic investments
- Monitor and rebalance regularly
- Automate investment processes
- Maintain discipline with investments
- Regularly review portfolio performance
- Adjust strategy as life circumstances change
Stock Analysis Tools
Calculate key valuation metrics to assess if a stock is fairly priced.
Analyze potential returns based on different price scenarios.
Calculate dividend income and yield for income-focused investing.
Assess the risk level of a stock investment based on key factors.
Calculate how many stocks you need for proper diversification.
Stock Market Learning Quiz
When you buy a share of stock in a company, what do you own?
When you buy a share of stock, you own a portion of the company's assets and earnings proportional to the number of shares you hold. Stocks represent equity ownership in a corporation, giving shareholders claims on assets and earnings, as well as voting rights in corporate decisions.
The answer is B) A portion of the company's assets and earnings.
This question clarifies the fundamental concept of stock ownership. Stocks don't give you complete control of a company (unless you own a majority stake), but rather a proportional claim to the company's assets and profits. The more shares you own, the larger your ownership stake and voting power. This fractional ownership is what makes stock investing accessible to individuals with varying investment amounts.
Equity: Ownership interest in a company
Assets: Company resources and property
Earnings: Company profits and income
• Stocks represent proportional ownership
• More shares = more ownership stake
• Ownership comes with voting rights
• Understand what you own when buying stock
• Research company fundamentals
• Consider voting rights in your investment
• Thinking stock equals complete company ownership
• Ignoring voting rights significance
• Not understanding proportional ownership
Explain what the P/E (Price-to-Earnings) ratio measures, how to interpret it, and why it's important for stock valuation.
P/E Ratio Definition: The P/E ratio compares a company's stock price to its earnings per share (EPS). It shows how much investors are willing to pay for each dollar of earnings.
Formula: P/E Ratio = Price Per Share ÷ Earnings Per Share
Interpretation: A high P/E ratio suggests investors expect higher growth in the future, while a low P/E ratio may indicate the stock is undervalued or the company has slower growth prospects.
Importance: The P/E ratio helps investors compare valuations across companies and industries, though it should be used alongside other metrics for comprehensive analysis.
The P/E ratio is one of the most commonly used valuation metrics. It essentially tells you how much you're paying for each dollar of a company's earnings. For example, a P/E of 20 means you're paying $20 for every $1 of earnings. However, interpretation depends on context—the same P/E ratio can mean different things for different companies depending on their growth prospects, industry, and market conditions.
P/E Ratio: Price-to-earnings valuation metric
Earnings Per Share: Company earnings divided by shares outstanding
Valuation: Determining fair market value
• Compare P/E ratios within same industry
• Consider growth prospects when interpreting
• Use alongside other valuation metrics
• Compare to industry averages
• Consider historical P/E trends
• Factor in growth expectations
• Comparing P/E ratios across different industries
• Using trailing P/E during volatile periods
• Relying solely on P/E ratio
John buys 200 shares of ABC Corporation at $50 per share. ABC pays an annual dividend of $2.00 per share. If John holds the shares for 5 years and reinvests all dividends (buying more shares), how much dividend income will he receive in total, assuming the stock price remains constant? What is his total return including dividends?
Initial Investment: 200 shares × $50 = $10,000
Annual Dividend Income: 200 shares × $2.00 = $400
Total Dividend Income (5 years): $400 × 5 = $2,000
Dividend Reinvestment: With no price change, dividends would buy 4 shares per year ($400 ÷ $50), totaling 20 additional shares.
Final Holdings: 220 shares × $50 = $11,000
Total Return: ($11,000 + $2,000 - $10,000) ÷ $10,000 = 30%
John receives $2,000 in dividend income and achieves a 30% total return over 5 years.
This problem demonstrates the power of dividend investing and reinvestment. Even without stock price appreciation, dividends provide income and can be reinvested to purchase more shares, which then generate more dividends. This compounding effect accelerates over time, making dividend reinvestment a powerful wealth-building strategy. The example shows how both income and growth components contribute to total returns.
Dividend: Portion of company profits distributed to shareholders
Dividend Reinvestment: Using dividends to buy more shares
Total Return: Combined effect of price appreciation and dividends
• Reinvesting dividends accelerates growth
• Dividends provide income regardless of price movement
• Consider tax implications of dividends
• Use dividend reinvestment plans (DRIPs)
• Look for companies with consistent dividend history
• Consider dividend growth rate
• Not reinvesting dividends for compounding
• Focusing only on high dividend yield
• Ignoring dividend sustainability
You're evaluating two stocks: TechCo with a beta of 1.8 and a debt-to-equity ratio of 0.3, and UtilityCo with a beta of 0.6 and a debt-to-equity ratio of 1.2. TechCo has a P/E ratio of 35, while UtilityCo has a P/E ratio of 15. Which stock appears riskier, and what factors contribute to this risk? How would you incorporate this information into your investment decision?
TechCo Risk Factors:
- High beta (1.8) indicates 80% more volatility than market
- High P/E ratio (35) suggests expensive valuation
- Low debt-to-equity (0.3) indicates strong balance sheet
UtilityCo Risk Factors:
- Low beta (0.6) indicates 40% less volatility than market
- Moderate P/E ratio (15) suggests reasonable valuation
- High debt-to-equity (1.2) indicates significant leverage
Overall Assessment: TechCo appears riskier due to high volatility and expensive valuation, while UtilityCo is more stable but has higher financial leverage. Investment decision should consider risk tolerance and investment goals.
This problem illustrates that risk assessment requires multiple metrics. Beta measures market volatility, debt-to-equity assesses financial leverage risk, and P/E ratio evaluates valuation risk. Different investors have different risk tolerances—some prefer stable utility stocks, others accept higher volatility for growth potential. The key is understanding various risk dimensions and aligning investments with personal risk tolerance and time horizon.
Beta: Measure of stock volatility relative to market
Debt-to-Equity: Financial leverage ratio
Valuation Risk: Risk from overpriced securities
• Assess multiple risk factors together
• Match risk level to investment goals
• Diversify across risk profiles
• Balance high-risk with low-risk investments
• Consider your investment timeline
• Review risk metrics regularly
• Focusing on single risk metric
• Taking excessive risk for returns
• Not matching risk to goals
Which of the following best describes the significance of market capitalization in stock investing?
Market capitalization (market cap) is calculated by multiplying the stock price by the number of shares outstanding. It indicates the company's size and provides insights into its investment risk profile. Generally, large-cap stocks are considered less risky but with lower growth potential, while small-cap stocks are more volatile but offer higher growth potential. Market cap helps investors categorize stocks and understand their risk-return characteristics.
The answer is B) It indicates the company's size and investment risk profile.
Market capitalization is a crucial classification tool in stock investing. It helps investors understand the scale of a company and its position in the market. Large-cap companies ($10B+) tend to be more stable but offer slower growth. Mid-cap companies ($2B-$10B) balance growth and stability. Small-cap companies (<$2B) offer higher growth potential but come with greater volatility. Understanding market cap categories helps investors build diversified portfolios with appropriate risk levels.
Market Cap: Total market value of company's shares
Large-Cap: Large, established companies
Small-Cap: Smaller, potentially faster-growing companies
• Diversify across market cap categories
• Match company size to investment goals
• Consider risk-return profile of each category
• Include different market caps in portfolio
• Adjust allocation based on age and risk tolerance
• Monitor market cap changes over time
• Only investing in one market cap category
• Confusing market cap with profitability
• Not diversifying by company size
FAQ
Q: I'm new to investing. Should I start with individual stocks or index funds?
A: For beginners, starting with index funds is generally recommended:
1. Diversification: Instantly spread risk across hundreds of companies
2. Lower Risk: Reduced volatility compared to individual stocks
3. Lower Effort: No need to research individual companies
4. Lower Costs: Typically lower expense ratios than actively managed funds
5. Consistent Returns: Historically matches market performance
Once you've gained experience and built a foundation with index funds, you can gradually add individual stocks to your portfolio. Start with 80-90% in diversified index funds and reserve 10-20% for individual stock picks as you become more experienced.
Q: What's the difference between common stock and preferred stock?
A: The main differences are:
Common Stock:
• Voting rights in corporate decisions
• Potential for capital appreciation
• Dividends vary based on company performance
• Last in line during liquidation
Preferred Stock:
• Usually no voting rights
• Fixed dividend payments (like bonds)
• Higher priority in dividend payments
• Higher priority in liquidation
• Less potential for capital appreciation
Most individual investors focus on common stocks due to growth potential and voting rights. Preferred stocks behave more like bonds with stock-like features.
Q: How many stocks should I own to be properly diversified?
A: Research shows that most diversification benefits are achieved with 15-20 individual stocks, but here's a practical approach:
1. Beginners: 1-2 broad market index funds (instant diversification)
2. Intermediate: 10-15 individual stocks across sectors
3. Advanced: 15-25 stocks with careful selection
Key principles:
• Don't own more stocks than you can research effectively
• Spread across sectors and market caps
• Consider geographic diversification
• Index funds provide easy diversification
Remember: diversification reduces unsystematic risk (company-specific), but not systematic risk (market-wide). The goal is to avoid over-concentration in any single investment.