What is Risk Management?
Complete risk management guide • Step-by-step explanations
Risk Management Fundamentals:
Show Risk AnalysisRisk management is the process of identifying, analyzing, and controlling threats to an organization's capital and earnings. In investing, it refers to strategies and techniques used to minimize and control exposure to various types of risk. Effective risk management helps investors achieve their financial goals while limiting potential losses and volatility.
Key risk management components:
- Risk Identification: Recognizing potential threats and exposures
- Risk Assessment: Measuring and evaluating identified risks
- Risk Mitigation: Implementing strategies to reduce risk
- Risk Monitoring: Ongoing tracking and evaluation
- Diversification: Spreading investments to reduce concentration risk
- Hedging: Using instruments to offset potential losses
Successful risk management requires a systematic approach that balances risk and return to achieve investment objectives.
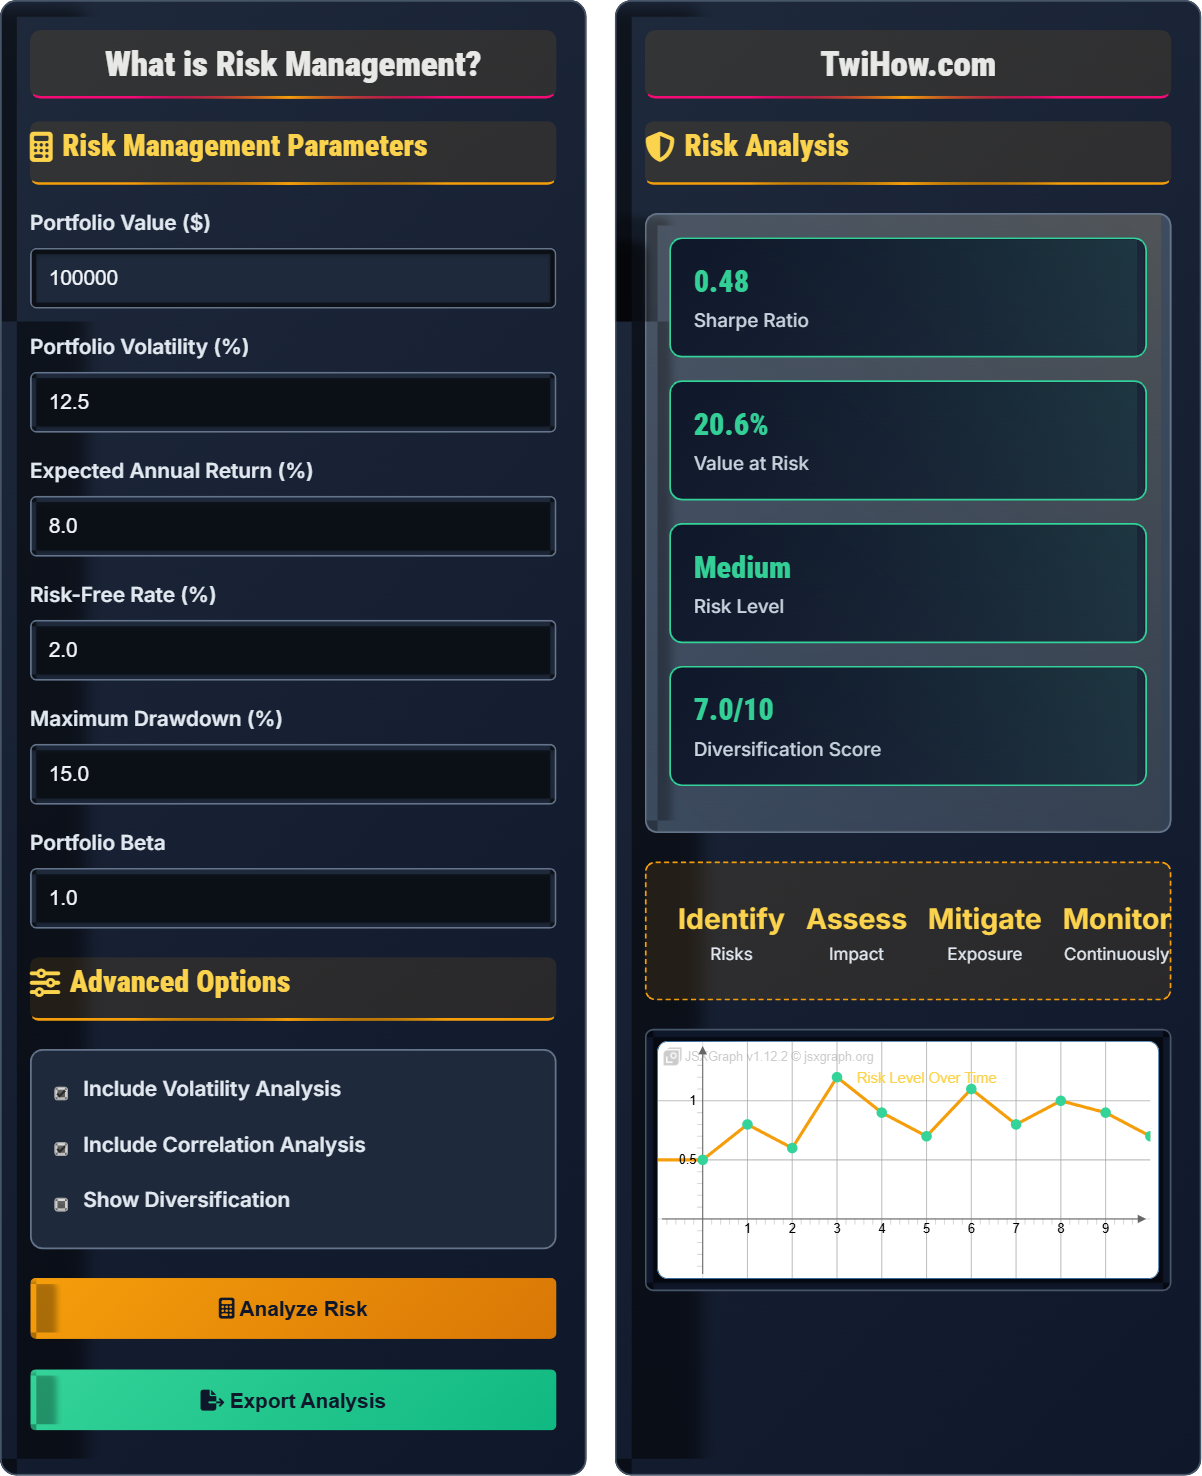
Risk Management Parameters
Advanced Options
Risk Analysis
Key concepts for risk management:
- Risk is the possibility of losing money
- Volatility measures risk magnitude
- Diversification reduces unsystematic risk
- Correlation affects diversification benefits
- Alpha measures excess return over risk
- Beta measures market sensitivity
| Metric | Value | Interpretation | Recommendation |
|---|---|---|---|
| Sharpe Ratio | 0.48 | Moderate risk-adjusted return | Consider diversification |
| Volatility | 12.5% | Moderate risk level | Acceptable for long-term |
| Beta | 1.0 | Market correlated | Expected market movement |
| Max Drawdown | 15.0% | Moderate peak-to-trough | Within acceptable range |
| VAR | 5.0% | Confidence level risk | Manageable downside |
How Risk Management Works
Risk management is the process of identifying, assessing, and controlling threats to an organization's capital and earnings. In investing, it refers to strategies and techniques used to minimize and control exposure to various types of risk. The goal is to achieve the best possible return for a given level of risk, or to minimize risk for a given level of return.
Where:
- Sharpe Ratio: Measures risk-adjusted return
- VaR: Estimates potential loss at confidence level
- Beta: Measures systematic risk relative to market
- Z-Score: Statistical measure of standard deviations
Popular risk management strategies include:
- Diversification: Spreading investments across asset classes
- Hedging: Using derivatives to offset potential losses
- Asset Allocation: Strategic distribution of investments
- Stop-Loss Orders: Automatic selling at predetermined prices
- Position Sizing: Limiting exposure per investment
- Correlation Analysis: Understanding asset relationships
- Know Your Risk Tolerance: Align investments with comfort level
- Diversify Appropriately: Balance risk and return
- Monitor Regularly: Track risk metrics consistently
- Understand Correlations: Know how assets move together
- Use Risk Metrics: Apply quantitative measures
- Stay Informed: Keep up with market conditions
Risk Management Fundamentals
Volatility, correlation, beta, alpha, Sharpe ratio, VaR, diversification, hedging, systematic risk, unsystematic risk.
Sharpe Ratio = (Portfolio Return - Risk-Free Rate) / Portfolio Standard Deviation
Value at Risk (VaR) = Portfolio Value × Z-Score × Volatility
Beta = Covariance(Rp, Rm) / Variance(Rm)
Where Sharpe measures risk-adjusted return.
- Higher returns typically require accepting higher risk
- Diversification reduces unsystematic risk
- Correlation affects diversification effectiveness
- Risk should be measured quantitatively
- Regular monitoring is essential
Risk Management Applications
Portfolio construction, asset allocation, hedging strategies, position sizing, risk reporting.
- Identify potential risks
- Quantify risk exposure
- Select appropriate strategies
- Implement risk controls
- Monitor continuously
- Adjust as needed
- Use quantitative risk measures
- Maintain discipline with strategies
- Regular portfolio reviews
- Adjust for changing conditions
Risk Management Tools
Calculate and analyze portfolio volatility for risk assessment.
Measure correlation between different assets to optimize diversification.
Assess the level of diversification in your portfolio.
Calculate the systematic risk of your portfolio relative to the market.
Risk Management Learning Quiz
What is the difference between systematic and unsystematic risk?
Systematic risk affects entire markets and cannot be eliminated through diversification. Examples include interest rate changes, inflation, and political events. Unsystematic risk affects individual companies or industries and can be reduced through diversification. Examples include management decisions, product recalls, or industry-specific issues.
The answer is B) Systematic risk affects entire markets; unsystematic affects individual companies.
This question highlights a fundamental concept in risk management. Systematic risk (also called market risk) is inherent to the entire market and affects all investments. It cannot be eliminated through diversification because it impacts the entire system. Unsystematic risk (also called specific risk) is unique to individual companies or industries and can be reduced by holding a diversified portfolio. Understanding this distinction is crucial for developing effective risk management strategies.
Systematic Risk: Market-wide risk that cannot be diversified away
Unsystematic Risk: Company-specific risk that can be diversified
Diversification: Spreading investments to reduce risk
• Systematic risk cannot be eliminated through diversification
• Unsystematic risk can be reduced through diversification
• Both types of risk contribute to total portfolio risk
• Focus diversification efforts on unsystematic risk
• Accept systematic risk as part of market participation
• Understand what types of risk you're taking
• Thinking diversification eliminates all risk
• Not understanding the difference between risk types
• Over-diversifying to avoid systematic risk
Explain the Sharpe Ratio, how it's calculated, and why it's important for risk management. What does a Sharpe Ratio of 1.0 mean compared to 0.5?
Sharpe Ratio Definition: The Sharpe Ratio measures risk-adjusted return by comparing excess return over risk-free rate to portfolio volatility.
Formula: (Portfolio Return - Risk-Free Rate) / Portfolio Standard Deviation
Interpretation: A higher Sharpe Ratio indicates better risk-adjusted performance. A ratio of 1.0 means the portfolio generates 1 unit of excess return per unit of risk, while 0.5 means 0.5 units of excess return per unit of risk. The portfolio with Sharpe Ratio of 1.0 is twice as efficient at generating return per unit of risk.
Importance: Allows comparison of investments with different risk levels.
The Sharpe Ratio is one of the most important risk-adjusted performance measures. It helps investors understand whether they're being adequately compensated for the risk they're taking. A portfolio with a higher return but also higher risk might actually be worse than a portfolio with lower return but lower risk, depending on the Sharpe Ratio. This metric is essential for comparing different investment options and making informed decisions about risk-return tradeoffs.
Sharpe Ratio: Risk-adjusted return measure
Excess Return: Return above risk-free rate
Risk-Adjusted: Adjusted for level of risk taken
• Higher Sharpe Ratios are better
• Compare investments using Sharpe Ratios
• Consider both return and risk
• Use Sharpe Ratio for comparing similar investments
• Consider time period when evaluating
• Negative ratios indicate poor performance
• Only looking at returns without considering risk
• Not using consistent time periods
• Ignoring the risk-free rate
Portfolio A consists of 100% stocks from a single company with a volatility of 25%. Portfolio B consists of 10 different stocks from various industries with an average volatility of 25% each. Both portfolios have the same expected return. Which portfolio has lower overall risk, and why? What principle of risk management does this illustrate?
Portfolio B has lower overall risk because it benefits from diversification. Even though each stock has 25% volatility, the correlations between different companies are typically less than 1.0, meaning they don't move perfectly in sync. When some stocks decline, others may rise or remain stable, reducing the overall portfolio volatility.
Calculation Example: If the average correlation between stocks is 0.3, the portfolio volatility might be around 15-18% instead of 25%.
Principle Illustrated: Diversification reduces unsystematic risk without necessarily reducing expected returns.
This example demonstrates the mathematical benefit of diversification. The key insight is that portfolio risk is not simply the average of individual asset risks, but depends on how the assets move together (correlation). When correlations are less than 1.0, diversification creates a portfolio with lower risk than the weighted average of individual risks. This is the mathematical foundation of modern portfolio theory and one of the most important concepts in risk management.
Correlation: Degree to which assets move together
Diversification: Reducing risk through variety
Portfolio Volatility: Overall risk of combined investments
• Portfolio risk ≠ Average of individual risks
• Correlation affects diversification benefits
• Diversification reduces unsystematic risk
• Look for low correlation between holdings
• Diversify across asset classes and geographies
• More holdings increase diversification benefits
• Thinking more holdings always means better diversification
• Not considering correlation between assets
• Diversifying across similar assets
You're analyzing two stocks: Stock X has a beta of 1.5, and Stock Y has a beta of 0.7. The market is expected to decline by 10% next year. Based on beta alone, what would you expect to happen to each stock? How would you use this information in your risk management strategy?
Stock X (Beta = 1.5): Expected to decline by 1.5 × 10% = 15%
Stock Y (Beta = 0.7): Expected to decline by 0.7 × 10% = 7%
Risk Management Application:
• Stock X is more volatile than the market and amplifies market movements
• Stock Y is less volatile than the market and dampens market movements
• In a declining market, Stock Y would be less risky
• For risk management, consider the beta when constructing your portfolio to match your risk tolerance
• A defensive portfolio might include more low-beta stocks
Beta is a crucial measure for understanding how individual securities move relative to the market. A beta of 1.0 means the security moves with the market, above 1.0 means it's more volatile than the market, and below 1.0 means it's less volatile. This information is essential for risk management because it helps predict how your portfolio might behave in different market conditions. Understanding beta allows investors to construct portfolios with desired risk characteristics.
Beta: Measure of systematic risk relative to market
Systematic Risk: Market-related risk that cannot be diversified
Market Beta: Reference value of 1.0
• Beta measures sensitivity to market movements
• Higher beta = higher systematic risk
• Beta is based on historical data
• Use beta to gauge market sensitivity
• Consider beta when building defensive portfolios
• Remember beta is based on historical data
• Thinking beta predicts exact future movements
• Ignoring other risk factors
• Using outdated beta values
What does a Value at Risk (VaR) of $5,000 at the 95% confidence level mean?
Value at Risk (VaR) of $5,000 at the 95% confidence level means there is a 5% chance of losing $5,000 or more over a specified time period. VaR is a statistical measure that estimates the maximum potential loss in value of a portfolio over a defined period for a given confidence interval. The 95% confidence level means that the loss should exceed the VaR amount only 5% of the time.
The answer is A) There is a 5% chance of losing $5,000 or more.
Value at Risk is an important risk measure that helps quantify potential losses. The key insight is understanding the confidence level - a 95% confidence level means that 95% of the time, losses will be less than the VaR amount, but 5% of the time, losses could exceed this amount. VaR is widely used by financial institutions for risk management and regulatory purposes. It provides a single number that summarizes the potential risk in a portfolio, making it easier to communicate risk levels.
Value at Risk (VaR): Maximum potential loss at confidence level
Confidence Level: Probability that loss will not exceed VaR
Risk Measure: Quantitative assessment of potential loss
• VaR is based on historical data and assumptions
• Does not predict losses beyond the confidence level
• Should be used with other risk measures
• Use VaR as one of multiple risk measures
• Understand the time period and confidence level
• Consider extreme scenarios beyond VaR
• Thinking VaR predicts exact losses
• Ignoring losses beyond confidence level
• Relying solely on VaR for risk management
FAQ
Q: How much risk should I take in my portfolio?
A: The appropriate level of risk depends on several factors:
1. Time Horizon: Longer timeframes allow for more risk
2. Financial Goals: Specific objectives and required returns
3. Risk Tolerance: Your comfort with volatility
4. Age: Younger investors can typically take more risk
5. Income Stability: Reliable income allows for more risk
6. Financial Obligations: Need for stable returns
Generally, risk should be aligned with your ability, willingness, and need to take risk. A financial advisor can help determine your optimal risk level based on these factors.
Q: Is it possible to eliminate all risk from investing?
A: No, it's not possible to eliminate all risk from investing:
Types of Risk That Cannot Be Eliminated:
• Inflation Risk: Purchasing power erosion
• Interest Rate Risk: Changes in interest rates
• Systematic Risk: Market-wide events
• Political/Legal Risk: Government policy changes
What Can Be Managed:
• Unsystematic Risk: Through diversification
• Concentration Risk: Through asset allocation
• Liquidity Risk: Through proper planning
The goal is not to eliminate all risk but to manage risk appropriately for your situation while achieving your investment objectives.
Q: How often should I review and adjust my risk management strategy?
A: Risk management strategy should be reviewed regularly:
Regular Reviews:
• Quarterly: Monitor risk metrics and performance
• Annually: Comprehensive portfolio review and rebalancing
Trigger Events:
• Life changes (marriage, birth, job change)
• Significant market events
• Changes in financial goals
• Major shifts in risk tolerance
Continuous Monitoring:
• Track risk metrics monthly
• Adjust position sizes as needed
• Monitor correlation changes
Regular review ensures your risk management strategy remains aligned with your objectives and market conditions.