What is ROI?
Complete ROI investing guide • Step-by-step explanations
ROI Fundamentals:
Show ROI AnalysisReturn on Investment (ROI) is a financial metric that measures the profitability of an investment relative to its cost. It's expressed as a percentage and represents the return generated for each dollar invested. ROI is one of the most commonly used performance measures in investing and business, helping investors evaluate the efficiency and profitability of their investments. The formula is straightforward: (Net Return / Investment Cost) × 100.
Key ROI components:
- Net Return: Total gains minus investment cost
- Investment Cost: Total amount invested
- Time Factor: Duration of investment
- Risk Adjustment: Risk level consideration
- Comparative Analysis: ROI vs. alternatives
- Annualization: ROI over time periods
ROI provides a standardized way to compare the performance of different investments, making it essential for investment decision-making.
ROI Analysis Parameters
Advanced Options
ROI Analysis
Key concepts for ROI analysis:
- ROI measures investment profitability
- Higher ROI indicates better performance
- Time-adjusted ROI provides better comparisons
- Real ROI accounts for inflation
- ROI should be compared to alternatives
- Consider risk-adjusted returns
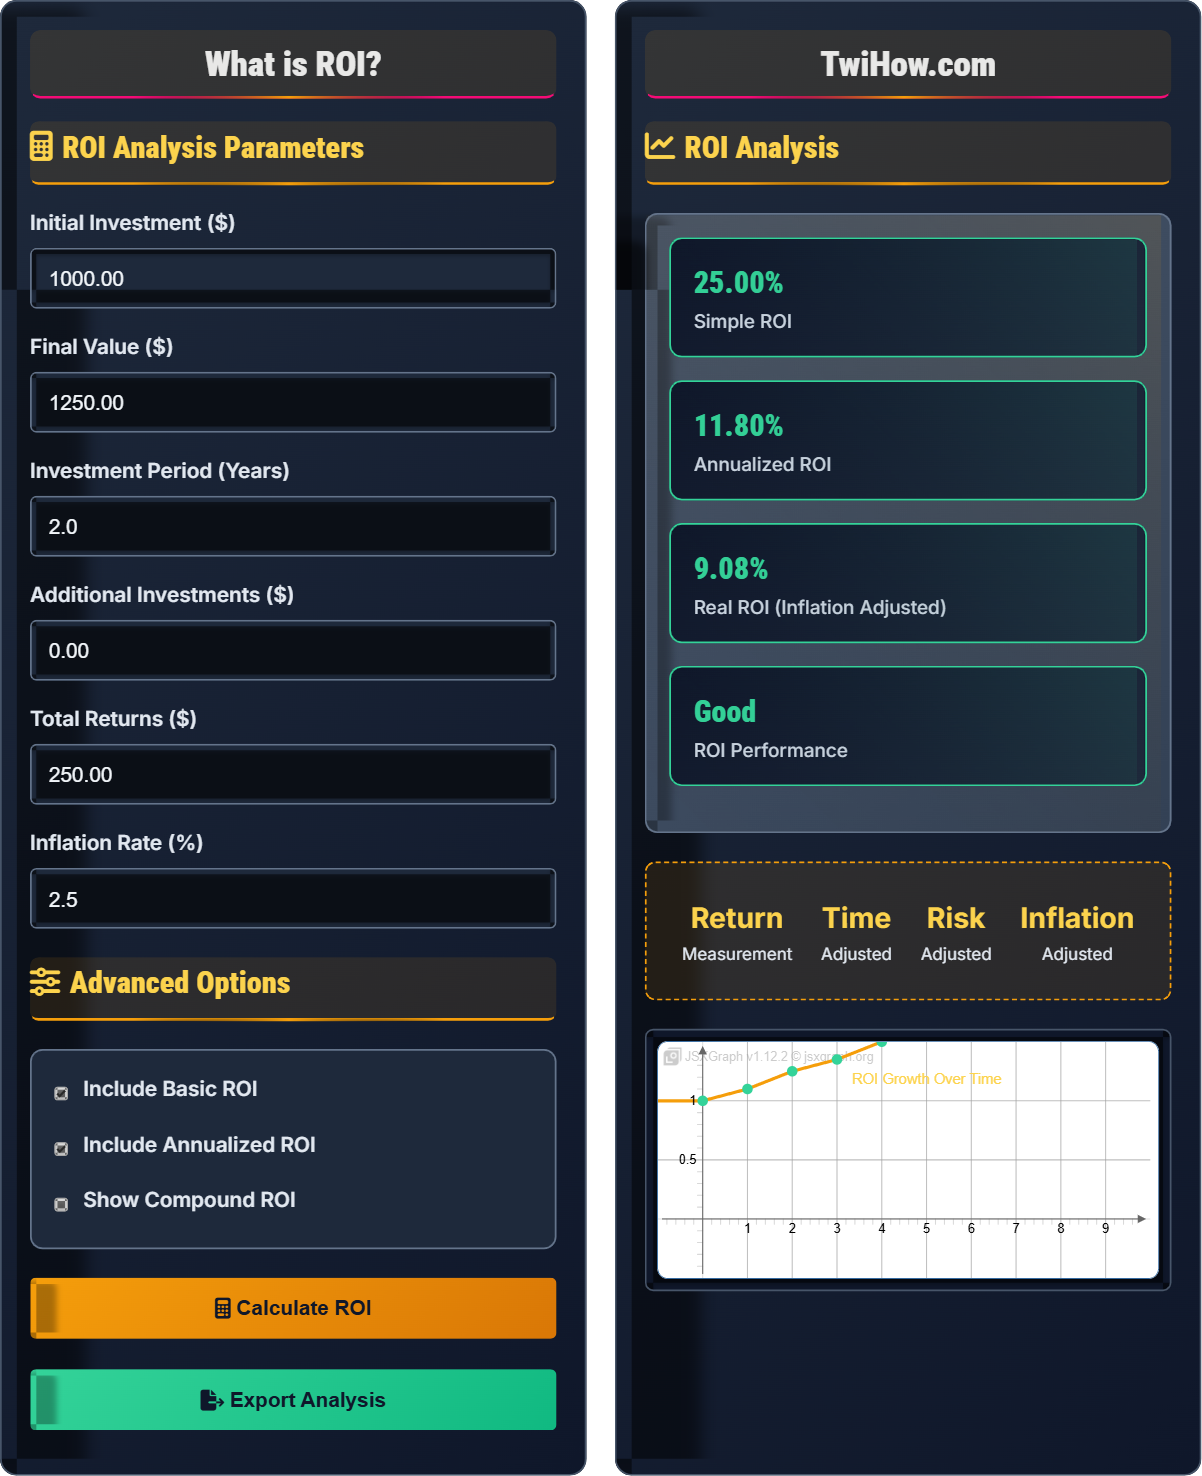
| Metric | Value | Interpretation | Significance |
|---|---|---|---|
| Initial Investment | $1,000.00 | Starting amount | Base for comparison |
| Final Value | $1,250.00 | Total proceeds | Total return |
| Net Return | $250.00 | Profit realized | Actual gain |
| Simple ROI | 25.00% | Overall return | Basic profitability |
| Annualized ROI | 11.80% | Yearly equivalent | Time-adjusted return |
How ROI Works
Return on Investment (ROI) is a performance measure used to evaluate the efficiency or profitability of an investment. It is calculated by dividing the net return (final value minus initial investment) by the initial investment cost, then multiplying by 100 to express it as a percentage. ROI provides a standardized way to compare the profitability of different investments regardless of their size.
Where:
- Simple ROI: Basic return percentage
- Annualized ROI: Time-adjusted return
- Real ROI: Inflation-adjusted return
- n: Number of years
- Net Return: Total gain from investment
Popular ROI analysis strategies include:
- Simple ROI: Basic return calculation for short-term investments
- Annualized ROI: Time-adjusted return for long-term comparisons
- Real ROI: Inflation-adjusted return for purchasing power
- IRR: Internal Rate of Return for complex cash flows
- Modified ROI: Adjusted for risk and other factors
- Comparative Analysis: ROI vs. alternative investments
- Consider Time Value: Annualize returns for meaningful comparisons
- Account for Inflation: Use real returns for accurate assessment
- Factor in Risk: Adjust ROI for risk level differences
- Include All Costs: Account for fees, taxes, and expenses
- Compare to Benchmarks: Evaluate against market indices
- Consider Tax Implications: Factor in after-tax returns
ROI Fundamentals
Return on Investment, simple ROI, annualized ROI, real ROI, net return, investment cost, time value of money.
Simple ROI = (Final Value - Initial Investment) / Initial Investment × 100%
Annualized ROI = (Final Value / Initial Investment)^(1/n) - 1
Real ROI = (1 + Nominal ROI) / (1 + Inflation Rate) - 1
Where ROI measures return relative to investment cost.
- Always calculate net returns after expenses
- Annualize returns for time-based comparisons
- Adjust for inflation to measure real returns
- Consider risk when comparing ROI figures
- Include all relevant costs in investment calculation
ROI Applications
Investment comparison, portfolio performance, business decisions, project evaluation, asset allocation.
- Identify investment costs
- Calculate final values
- Apply ROI formulas
- Adjust for time and inflation
- Compare to benchmarks
- Make investment decisions
- Use multiple ROI measures together
- Maintain discipline with calculations
- Regular portfolio reviews
- Adjust for changing conditions
ROI Analysis Tools
Calculate simple return on investment for basic analysis.
Calculate time-adjusted return for meaningful comparisons.
Calculate compound growth over multiple periods.
Calculate ROI adjusted for risk level.
Compare ROI across different investment options.
ROI Learning Quiz
If you invest $1,000 and it grows to $1,250, what is the simple ROI?
Simple ROI is calculated as: (Final Value - Initial Investment) / Initial Investment × 100%. In this case: ($1,250 - $1,000) / $1,000 × 100% = $250 / $1,000 × 100% = 0.25 × 100% = 25%. This means you earned $0.25 for every $1 invested.
The answer is B) 25%.
The basic ROI formula is fundamental to investment analysis. It provides a standardized way to measure profitability regardless of investment size. The result shows the percentage return on your initial investment. In this example, a 25% ROI means the investment grew by 25% of the original amount. This simple metric allows for easy comparison between different investment opportunities.
Simple ROI: Basic return percentage calculation
Net Return: Total gain minus initial investment
Investment Cost: Total amount invested
• Always subtract initial investment from final value
• Divide by initial investment amount
• Multiply by 100 to convert to percentage
• Include all costs in initial investment
• Consider time factor for better comparisons
• Compare to risk-free alternatives
• Forgetting to subtract initial investment
• Dividing by final value instead of initial
• Not converting to percentage
Explain why annualized ROI is important and how to calculate it. Why can't you simply divide simple ROI by the number of years?
Annualized ROI Importance: Annualized ROI allows for fair comparison between investments held for different time periods. A 25% return over 2 years is much better than a 25% return over 5 years.
Calculation Formula: Annualized ROI = (Final Value / Initial Investment)^(1/n) - 1, where n is the number of years.
Why Not Simple Division: ROI compounds over time. Simply dividing by years ignores the compounding effect. For example, $1,000 growing to $1,250 over 2 years: Simple division would give 25%/2 = 12.5% annually, but the actual annualized return is 11.8%, accounting for compounding.
Annualized ROI is crucial because it standardizes returns to a yearly basis, enabling apples-to-apples comparisons. The compounding nature of returns means that investment growth builds on previous growth. Simple division fails to account for this exponential growth pattern. The geometric mean formula properly captures the compounding effect, giving the true equivalent annual return that would result in the same final value.
Annualized ROI: Time-adjusted return measure
Compounding: Growth on previous growth
Geometric Mean: Proper method for time-adjusted returns
• Always annualize returns for comparison
• Use geometric mean, not arithmetic mean
• Consider the compounding effect
• Use annualized ROI for time-based comparisons
• Consider total return period
• Factor in reinvestment assumptions
• Dividing simple ROI by years
• Not accounting for compounding
• Comparing different time periods without adjustment
You invested $5,000 in a stock that grew to $6,500 over 3 years. During the same period, inflation averaged 3% annually. Calculate the real return (inflation-adjusted ROI) and explain why this matters for investment decisions.
Simple ROI: ($6,500 - $5,000) / $5,000 = 30% over 3 years
Annualized ROI: ($6,500 / $5,000)^(1/3) - 1 = 9.14% per year
Real ROI: (1 + 0.0914) / (1 + 0.03) - 1 = 5.96% per year
Explanation: While your investment grew by 9.14% annually, inflation reduced purchasing power by 3% annually, resulting in a real gain of only 5.96%. This matters because it shows the actual increase in your purchasing power, not just nominal growth.
Real return accounts for the erosion of purchasing power caused by inflation. Even if your investment shows positive nominal returns, if inflation is higher, you're actually losing purchasing power. The real return formula adjusts nominal returns by inflation, revealing the true economic benefit of your investment. This is crucial for long-term financial planning, as inflation can significantly impact the actual value of your investments over time.
Real Return: Inflation-adjusted investment return
Real ROI: Return after inflation adjustment
Purchasing Power: Value of money in terms of goods/services
• Always consider inflation impact
• Real return shows true value growth
• High inflation erodes investment value
• Monitor inflation rates regularly
• Consider inflation-protected investments
• Factor inflation into long-term planning
• Ignoring inflation in ROI calculations
• Confusing nominal with real returns
• Not considering inflation impact on long-term goals
You're comparing two investments: Investment A has an 8% annual return with 12% volatility, and Investment B has a 10% annual return with 20% volatility. The risk-free rate is 3%. Calculate the Sharpe Ratio for each and determine which investment offers better risk-adjusted returns.
Investment A Sharpe Ratio: (8% - 3%) / 12% = 0.42
Investment B Sharpe Ratio: (10% - 3%) / 20% = 0.35
Analysis: Despite Investment B having a higher absolute return, Investment A offers better risk-adjusted returns. For every unit of risk taken, Investment A provides 0.42 units of excess return, while Investment B provides only 0.35 units. This means Investment A is more efficient at generating returns relative to its risk.
The Sharpe Ratio is a crucial metric for comparing investments with different risk levels. It measures excess return (above risk-free rate) per unit of risk (volatility). A higher Sharpe Ratio indicates better risk-adjusted performance. In this example, Investment A's superior Sharpe Ratio shows it's more efficient at generating returns for the risk taken. This is important because simply looking at returns can be misleading when comparing investments with different risk profiles.
Sharpe Ratio: Risk-adjusted return measure
Volatility: Standard deviation of returns
Excess Return: Return above risk-free rate
• Higher Sharpe Ratio indicates better risk-adjusted returns
• Compare investments using risk-adjusted metrics
• Consider both return and risk
• Use Sharpe Ratio for comparing similar investments
• Consider other risk-adjusted metrics too
• Factor in your personal risk tolerance
• Only comparing absolute returns
• Ignoring risk when evaluating investments
• Not considering risk-adjusted performance
Which of the following is NOT a limitation of using ROI as the sole measure for investment decisions?
ROI does have limitations including: not considering the time value of money (without annualization), not accounting for risk differences between investments, and not considering the size of investment (a 10% ROI on $1,000 is different from 10% on $100,000 in absolute terms). However, the fact that ROI is easy to calculate and understand is actually a strength, not a limitation.
The answer is D) ROI is easy to calculate and understand.
While ROI is a valuable and widely-used metric, it has important limitations that investors should understand. The time value of money issue means that a 20% return over 1 year is much better than 20% over 5 years. The risk issue means that two investments with the same ROI might have vastly different risk profiles. However, ROI's simplicity is indeed a major advantage that makes it accessible and useful for quick comparisons, even though it shouldn't be used in isolation.
Time Value of Money: Money is worth more today than future
Risk-Adjusted: Return adjusted for risk level
Limitations: Constraints of the metric
• Use ROI with other metrics
• Consider risk when comparing investments
• Account for time value of money
• Combine ROI with other performance metrics
• Consider both relative and absolute returns
• Factor in personal investment goals
• Relying solely on ROI for investment decisions
• Not considering risk differences
• Ignoring time-adjusted returns
FAQ
Q: What's a good ROI to aim for in stock market investments?
A: Historically, the stock market has returned approximately 7-10% annually after inflation. However, this varies significantly:
Historical Averages:
• S&P 500: ~10% annual return before inflation
• After inflation: ~7% annual real return
Considerations:
• Risk tolerance and time horizon
• Market conditions and economic cycles
• Diversification across asset classes
• Individual investment skill and strategy
A reasonable long-term expectation might be 6-8% annual real returns for a diversified stock portfolio.
Q: How do I calculate ROI for investments with multiple cash flows?
A: For investments with multiple cash flows, use the Internal Rate of Return (IRR):
For Multiple Cash Flows:
• Use financial calculators or spreadsheet functions (XIRR for irregular timing)
• Input all cash flows (positive and negative) with dates
• IRR finds the discount rate that makes NPV = 0
Simple Example:
Year 0: -$1,000 (investment)
Year 1: $100 (dividend)
Year 2: $1,200 (sale proceeds)
IRR = 14.5%
For complex scenarios, use financial software or consult with professionals.
Q: Should I consider taxes when calculating ROI?
A: Yes, taxes significantly impact your actual returns:
Tax Considerations:
• Capital Gains: Short-term (1 year or less) taxed as ordinary income, long-term (over 1 year) at preferential rates (0%, 15%, or 20%)
• Dividends: Qualified dividends at preferential rates, non-qualified at ordinary income rates
• Tax-Advantaged Accounts: Traditional IRAs/401(k)s defer taxes, Roth accounts provide tax-free growth
• Tax-Loss Harvesting: Offset gains with losses
After-Tax ROI: Calculate your effective return after accounting for taxes to understand your true investment performance.