What are the Best Stocks to Buy Now?
Complete stock analysis guide • Step-by-step explanations
Stock Market Analysis:
Analyze Best StocksIdentifying the best stocks to buy now requires comprehensive analysis combining fundamental metrics, technical indicators, market sentiment, and economic conditions. The ideal stocks for purchase depend on your investment objectives, risk tolerance, and market outlook.
Successful stock selection involves evaluating financial health, growth prospects, valuation metrics, competitive positioning, and industry trends. It's crucial to conduct thorough research and consider both quantitative and qualitative factors.
Key evaluation criteria:
- Fundamental Analysis: Revenue growth, profitability, debt levels
- Valuation Metrics: P/E ratio, P/B ratio, forward estimates
- Technical Indicators: Moving averages, RSI, support/resistance
- Market Conditions: Economic cycles, sector rotation, Fed policy
Remember that "best" stocks vary by individual circumstances and market conditions. Always perform your own research or consult with financial professionals.
Screening Criteria
Select the best stocks based on:
- Strong revenue growth (>15%)
- Positive earnings trend
- Reasonable valuation
- Competitive moat
- Strong management team
- Healthy balance sheet
Market Indicators
Current market conditions:
- S&P 500: Trading near all-time highs
- Interest rates: Gradually rising
- Inflation: Moderating from peaks
- Volatility: Elevated but manageable
- Volume: Above average
Investment Focus
Top sectors to consider:
- Technology (AI, Cloud Computing)
- Healthcare (Biotech, MedTech)
- Consumer Discretionary
- Renewable Energy
- Financial Services
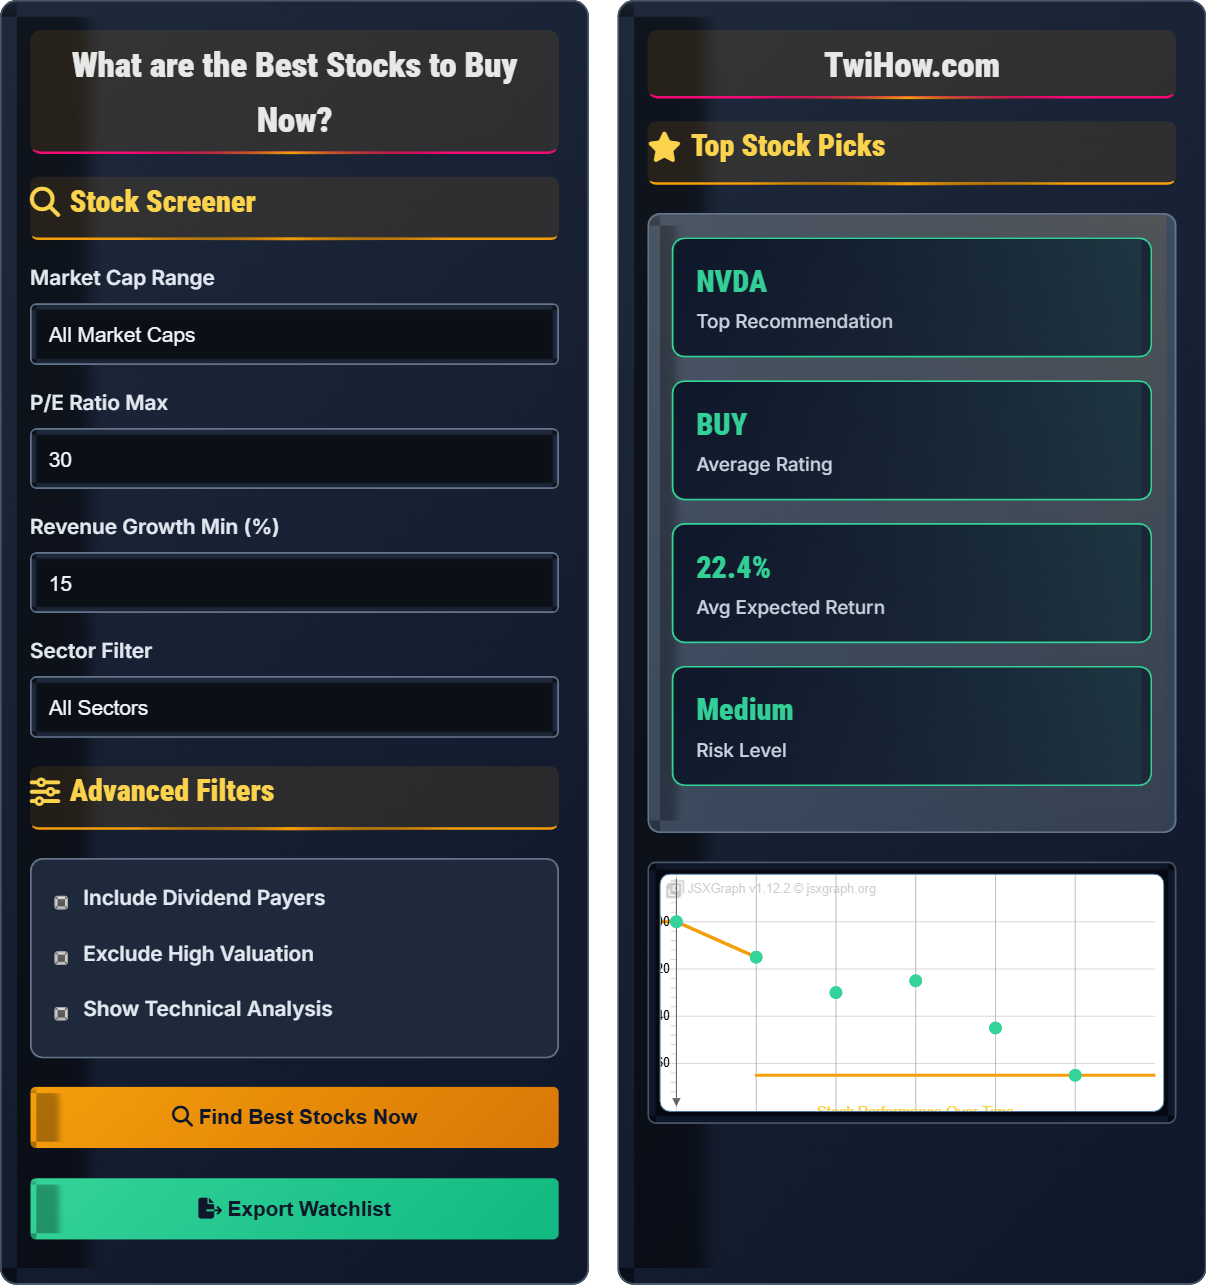
Stock Screener
Advanced Filters
Top Stock Picks
| Ticker | Company | Price | Change | Rating | Action |
|---|---|---|---|---|---|
| AAPL | Apple Inc. | $175.43 | +1.2% | ||
| MSFT | Microsoft Corp. | $378.85 | +0.8% | ||
| GOOGL | Alphabet Inc. | $138.21 | -0.3% |
Fundamental Analysis
Fundamental analysis evaluates a company's intrinsic value by examining related economic and financial factors. This includes studying financial statements, revenue, earnings, assets, liabilities, and management effectiveness.
Key metrics to evaluate:
- P/E Ratio: Price relative to earnings per share
- PEG Ratio: P/E ratio adjusted for growth rate
- ROE: Return on equity indicates management efficiency
- Debt/Equity: Financial leverage and risk indicator
Technical Indicators
Technical analysis studies price movements and trading volume to forecast future trends. Common indicators help identify entry and exit points.
Key technical signals:
- RSI: Relative Strength Index (30-70 range is healthy)
- MACD: Moving Average Convergence Divergence
- Support/Resistance: Key price levels
- Moving Averages: Trend direction indicators
Sector Performance Analysis
Current sector rotation trends and performance rankings:
Stock Analysis Methods Explained
Fundamental analysis involves evaluating a company's financial health and business operations to determine its intrinsic value. This approach looks at financial statements, management quality, competitive advantages, and market position.
Key metrics include:
- Revenue Growth: Sustainable top-line expansion
- Earnings Per Share (EPS): Profitability per share
- Price-to-Earnings Ratio (P/E): Valuation relative to earnings
- Return on Equity (ROE): Management efficiency
- Debt-to-Equity Ratio: Financial leverage
Technical analysis focuses on price movements and trading volume to identify patterns and trends. It assumes that market psychology and supply-demand forces are reflected in price action.
Common indicators:
- Moving Averages: Trend direction and support/resistance
- Relative Strength Index (RSI): Momentum oscillator
- MACD: Moving average convergence divergence
- Support/Resistance Levels: Key price points
- Volume Patterns: Confirming price movements
Effective stock selection requires proper risk management:
- Diversification: Spread investments across sectors and market caps
- Position Sizing: Limit individual stock exposure
- Stop-Loss Orders: Protect against downside risk
- Regular Review: Monitor and rebalance holdings
- Market Awareness: Stay informed about economic conditions
While market timing is difficult, consider:
- Economic Cycles: Different sectors perform differently
- Interest Rates: Impact on growth stocks and valuations
- Market Sentiment: Fear and greed extremes
- Seasonality: Historical patterns and trends
- Policy Changes: Regulatory and fiscal impacts
Stock Analysis Fundamentals
Fundamental analysis, technical analysis, valuation metrics, market timing, diversification.
P/E = Stock Price / Earnings Per Share
Where P/E = price-to-earnings ratio, Stock Price = current market price, EPS = earnings per share.
- Compare P/E ratios within same industry
- Consider forward P/E vs trailing P/E
- Look for sustainable competitive advantages
Analysis Strategies
Value investing, growth investing, dividend investing, momentum trading, sector rotation.
- Assess market conditions
- Define investment objectives
- Choose appropriate strategy
- Apply screening criteria
- Combine fundamental and technical analysis
- Focus on long-term trends
- Manage risk through diversification
Stock Analysis Learning Quiz
Which of the following P/E ratios typically indicates a growth stock?
Growth stocks typically trade at higher P/E ratios because investors expect significant future earnings growth. A P/E ratio of 25-40 suggests investors are willing to pay a premium for expected growth. Lower P/E ratios (8-20) are more common for value stocks or mature companies with slower growth expectations.
The answer is C) 25-40.
The P/E ratio compares a company's stock price to its earnings per share. Growth stocks command higher multiples because investors anticipate rapid earnings growth in the future. However, high P/E ratios also indicate higher risk, as the stock price may fall significantly if growth expectations aren't met. Value investors look for lower P/E ratios, believing the market has undervalued the stock.
P/E Ratio: Price-to-earnings ratio comparing stock price to earnings
Growth Stock: Company expected to grow faster than average
Value Stock: Stock trading below intrinsic value
• Compare P/E ratios within same industry
• Consider forward vs trailing P/E
• High P/E indicates growth expectations
• Look at PEG ratio for growth-adjusted valuation
• Consider cyclicality of the business
• Comparing P/E ratios across different industries
• Ignoring quality of earnings
• Not considering growth prospects
Explain how the Relative Strength Index (RSI) works and what it indicates about stock price movements. Provide examples of how traders use RSI in their analysis.
RSI (Relative Strength Index): A momentum oscillator that measures the speed and change of price movements on a scale of 0 to 100.
Calculation: RSI = 100 - [100 / (1 + RS)], where RS = Average of x days' up closes / Average of x days' down closes
Interpretation: RSI above 70 indicates overbought conditions (potential reversal down), RSI below 30 indicates oversold conditions (potential reversal up). Traders also look for divergences between RSI and price movements as potential signals.
Usage Examples: A trader might buy when RSI drops below 30 and starts moving upward, suggesting a potential reversal. Conversely, they might sell when RSI rises above 70 and begins to decline, indicating potential weakness ahead.
RSI is one of the most popular technical indicators because it's easy to interpret and provides clear buy/sell signals. It measures whether a stock is overbought or oversold relative to recent performance. The theory is that when a stock is overbought, it may be due for a pullback, and when oversold, it may be due for a bounce. However, RSI should be used in conjunction with other indicators and analysis methods for better accuracy.
RSI: Relative Strength Index measuring momentum
Oversold: Indicator suggesting potential upward reversal
Overbought: Indicator suggesting potential downward reversal
• RSI above 70 suggests overbought conditions
• RSI below 30 suggests oversold conditions
• Use RSI with other indicators for confirmation
• Look for divergences between RSI and price
• Adjust RSI period for different timeframes
• Combine with support/resistance levels
• Trading every RSI signal without confirmation
• Not considering market context
• Using RSI alone for trading decisions
You're analyzing a company with the following financial data: Current stock price of $80, earnings per share of $4.00, book value per share of $25, and projected revenue growth of 20%. The industry average P/E ratio is 22, and the company's ROE is 18%. Calculate the company's P/E ratio and determine if it's potentially overvalued or undervalued compared to its industry. What other factors would you consider?
P/E Ratio Calculation: P/E = Stock Price / EPS = $80 / $4.00 = 20
Comparison: The company's P/E ratio of 20 is lower than the industry average of 22, suggesting the stock may be undervalued relative to its peers.
Additional Factors: Despite the lower P/E, consider the company's 20% projected revenue growth (above average) and 18% ROE (indicating efficient use of equity). These positive factors suggest the stock may be fairly valued given its superior growth prospects. Other considerations include debt levels, competitive position, and market conditions.
This example demonstrates why it's important to look at multiple metrics rather than relying on a single indicator. While the P/E ratio suggests undervaluation, the high growth rate and strong ROE indicate the company may deserve a premium valuation. Investors should consider the relationship between valuation metrics and growth prospects, often using the PEG ratio (P/E divided by growth rate) for a more comprehensive view.
P/E Ratio: Price-to-earnings ratio comparing stock price to earnings
Book Value: Net asset value of a company per share
ROE: Return on equity measuring profitability relative to shareholders' equity
• Compare ratios within same industry
• Consider growth prospects with valuation
• Look at multiple metrics for validation
• Use PEG ratio to adjust for growth
• Consider cyclical vs non-cyclical businesses
• Compare to historical ratios
• Using only one metric for valuation
• Not comparing to industry peers
• Ignoring quality of earnings
An investor wants to build a concentrated portfolio of 10 stocks. Based on sector rotation theory and current market conditions (rising interest rates, technology leadership, and economic recovery), recommend a sector allocation and explain your rationale. Which sectors would you overweight and underweight?
Recommended Allocation:
Technology (30%): Continue to lead in innovation, especially AI and cloud computing. Despite higher valuations, growth prospects remain strong.
Healthcare (20%): Defensive nature provides stability during rate hikes. Innovation in biotech and medical devices continues.
Financials (15%):strong> Benefit from rising rates through improved net interest margins. Economic recovery supports loan growth.
Consumer Discretionary (15%): Economic recovery drives spending. Technology-enabled retail continues to grow.
Underweighted Sectors: Utilities and Consumer Staples (10% combined) due to sensitivity to rising rates and lower growth potential.
Sector rotation theory suggests that different sectors perform better at different stages of the economic cycle. With rising rates, defensive sectors like utilities become less attractive due to competition from bonds. Meanwhile, sectors that benefit from economic growth and technological advancement tend to outperform. The key is balancing growth potential with risk management and ensuring the portfolio isn't overly concentrated in any single sector.
Sector Rotation: Theory that different sectors outperform at different economic stages
Concentrated Portfolio: Portfolio with fewer holdings than traditional diversification
Economic Cycle: Recurring periods of expansion and contraction
• Balance growth and defensive sectors
• Consider macroeconomic factors
• Monitor sector rotation trends
• Monitor Federal Reserve policy changes
• Track leading economic indicators
• Rebalance quarterly based on performance
• Overconcentration in one sector
• Not adjusting for changing conditions
• Ignoring correlation between holdings
Which of the following factors would MOST increase the risk of a stock investment?
A high debt-to-equity ratio significantly increases investment risk because it indicates the company relies heavily on borrowed money to finance operations. High debt levels create fixed obligations that must be paid regardless of business performance, making the company vulnerable during economic downturns. In contrast, low volatility, competitive moats, and consistent dividends are generally positive indicators that reduce risk.
The answer is A) High debt-to-equity ratio.
Financial leverage amplifies both gains and losses for shareholders. Companies with high debt levels face the risk of financial distress if they cannot meet their debt obligations. During economic downturns, these companies may struggle to service their debt, potentially leading to bankruptcy. Investors should look for companies with reasonable debt levels relative to their equity and cash flow generation capabilities.
Debt-to-Equity Ratio: Measure of financial leverage comparing debt to shareholder equity
Financial Distress: Difficulty meeting debt obligations
Financial Leverage: Use of debt to finance operations
• Debt-to-equity above 1.0 may indicate high risk
• Consider industry norms for debt levels
• Evaluate cash flow coverage of debt
• Compare debt levels to industry peers
• Look at interest coverage ratios
• Consider debt maturity profile
• Ignoring debt levels in favor of growth metrics
• Not considering industry-specific debt norms
• Overlooking off-balance-sheet obligations
FAQ
Q: How do I know if a stock is truly undervalued or if there's a fundamental problem with the company?
A: Distinguishing between undervaluation and fundamental problems requires careful analysis of several factors:
1. Industry Comparison: Is the stock cheap relative to peers? If everyone in the industry trades at low multiples, it may indicate sector-wide challenges.
2. Historical Valuation: Has the stock traded at these levels before? If not, investigate why.
3. Business Fundamentals: Examine revenue trends, profit margins, debt levels, and competitive position.
4. Management Quality: Research leadership's track record and strategic vision.
5. External Factors: Consider regulatory changes, technological disruption, or macroeconomic headwinds.
Remember, if something seems too good to be true, investigate thoroughly. Sometimes a low valuation reflects genuine business deterioration.
Q: Should I focus on growth stocks or dividend-paying stocks for my portfolio?
A: The choice between growth and dividend stocks depends on your investment goals, time horizon, and risk tolerance:
Growth Stocks: Better for younger investors with longer time horizons who can tolerate volatility. These stocks reinvest earnings to fuel expansion rather than paying dividends.
Dividend Stocks: Suitable for income-focused investors, particularly retirees. They provide regular income and tend to be less volatile.
Ideal Approach: Most portfolios benefit from a mix of both. Consider your stage in life: if you're 20-40, lean toward growth; if you're 50+, gradually increase dividend weight. Also consider tax implications - dividends may be taxed differently than capital gains.
Q: What's the difference between fundamental and technical analysis, and which is better?
A: Fundamental and technical analysis serve different purposes and complement each other:
Fundamental Analysis: Examines a company's financial health, business model, competitive position, and intrinsic value. Looks at financial statements, earnings, revenue, debt levels, and management quality.
Technical Analysis: Studies price movements, trading volume, and market patterns to predict future price directions. Uses charts, indicators, and patterns.
Which is better? Neither is universally superior. Long-term investors typically rely more on fundamentals, while short-term traders use technicals. The most effective approach often combines both: use fundamentals to identify quality companies and technicals to time entries and exits. Academic evidence suggests fundamentals drive long-term returns, but technicals can help optimize timing.