What is BMI?
Complete health guide • Step-by-step explanations
Body Mass Index Guide:
Calculate Your BMIBody Mass Index (BMI) is a measure of body fat based on height and weight that applies to adult men and women. It's calculated by dividing your weight in kilograms by your height in meters squared. BMI is used as a screening tool to categorize individuals into underweight, normal weight, overweight, and obese categories.
BMI categories:
- Underweight: BMI less than 18.5
- Normal weight: BMI 18.5-24.9
- Overweight: BMI 25.0-29.9
- Obese: BMI 30.0 and above
While BMI is a useful screening tool, it has limitations and should be interpreted alongside other health indicators for a complete picture of health status.
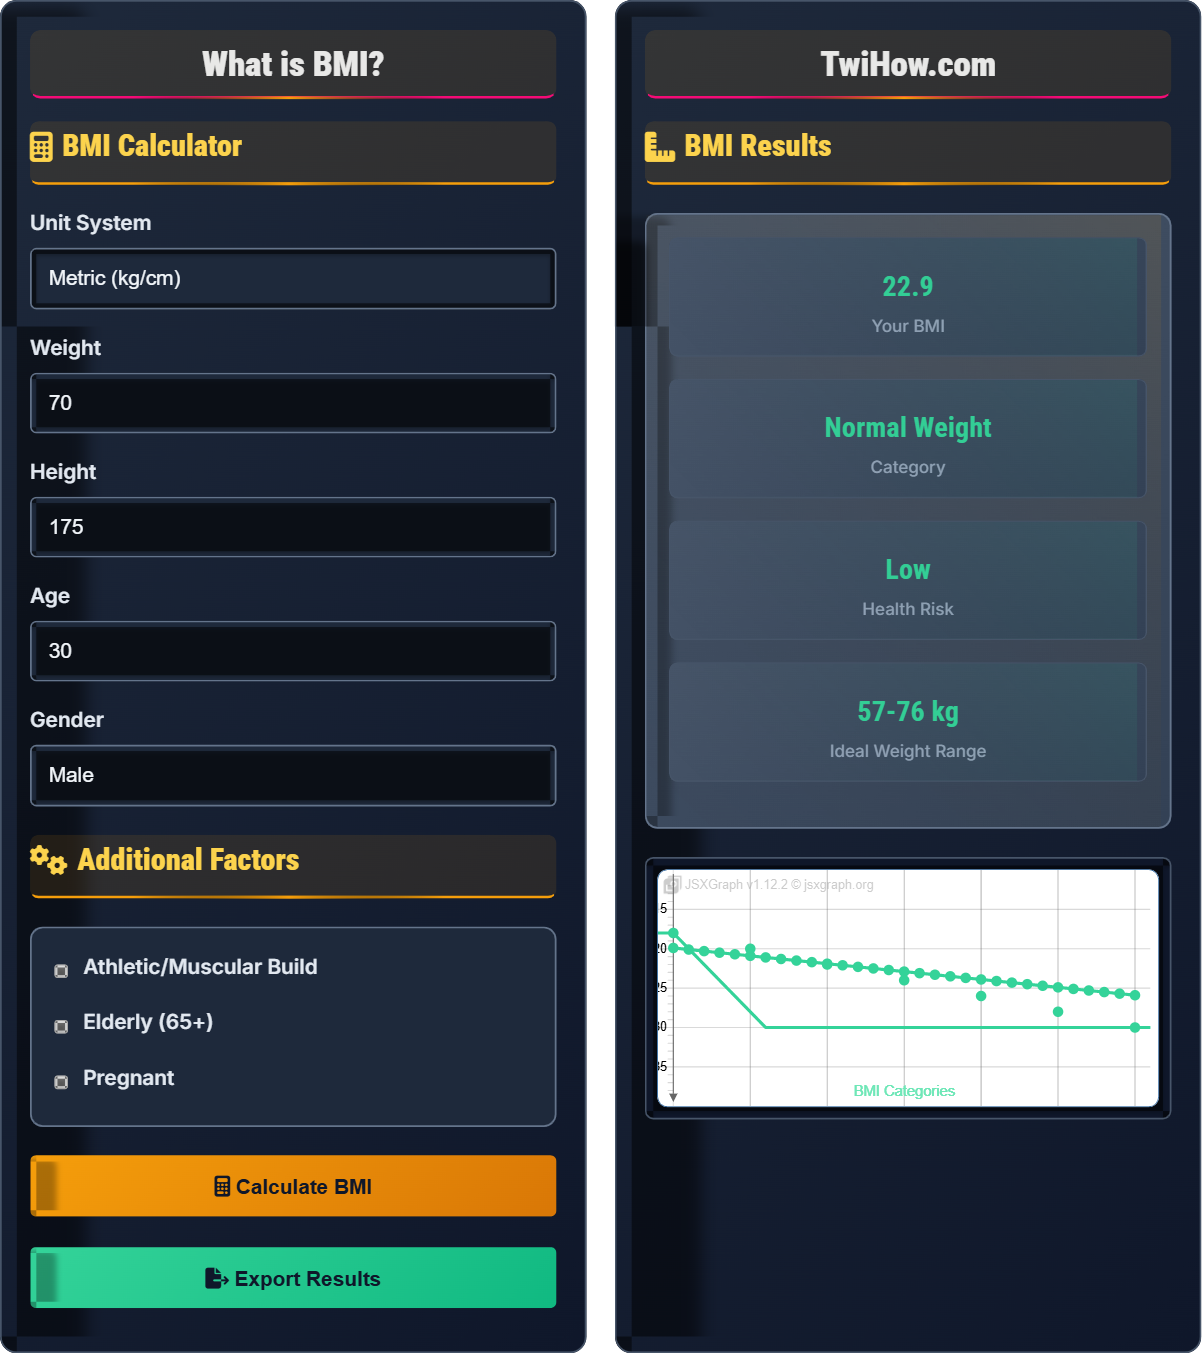
BMI Calculator
Additional Factors
BMI Results
Underweight: Malnutrition, osteoporosis, immune dysfunction
Low risk of weight-related health problems
Increased risk: diabetes, heart disease, hypertension
BMI Explained
Body Mass Index (BMI) is a person's weight in kilograms divided by the square of height in meters. BMI is an inexpensive and easy screening method for weight category—underweight, healthy weight, overweight, and obesity.
BMI does not measure body fat directly, but it is moderately correlated with more direct measures of body fat. Therefore, BMI can be thought of as an alternative for direct measures of body fat.
Where:
- Metric: Weight in kilograms, Height in meters
- Imperial: Weight in pounds, Height in inches
Health risks associated with BMI categories:
- Underweight: Osteoporosis, immune problems, fertility issues
- Normal: Lowest risk of weight-related diseases
- Overweight: Increased risk of diabetes, heart disease, stroke
- Obese: Significantly higher risk of chronic diseases
- Morbid Obesity: Severe health complications possible
- Muscle Mass: Doesn't distinguish muscle from fat
- Body Composition: Same BMI can mean different health risks
- Age: Older adults may have different health risks
- Gender: Men and women have different body compositions
- Ethnicity: Different populations have varying risk profiles
- Distribution: Doesn't account for fat distribution
BMI Categories
Underweight, normal weight, overweight, obese, morbidly obese.
BMI = Weight(kg) / Height(m)²
Or: BMI = Weight(lbs) × 703 / Height(in)²
- Normal: 18.5-24.9
- Overweight: 25.0-29.9
- Obese: 30.0+
- Consider limitations
Health Implications
Cardiovascular disease, diabetes, hypertension, joint problems.
- Calculate BMI
- Interpret category
- Assess other factors
- Consult healthcare provider
- Use as screening tool
- Consider other metrics
- Consult professionals
- Monitor trends
BMI Knowledge Learning Quiz
According to standard BMI classifications, what range is considered "Normal Weight"?
According to the World Health Organization (WHO) and most health organizations, a BMI of 18.5-24.9 is classified as "Normal Weight." This range is associated with the lowest risk of weight-related health problems. Below 18.5 is underweight, 25.0-29.9 is overweight, and 30.0 and above is obese.
The answer is B) 18.5-24.9.
Understanding BMI categories is fundamental to interpreting BMI values correctly. The normal weight range (18.5-24.9) represents the optimal balance between being underweight (health risks from malnutrition) and overweight (health risks from excess weight). This range is associated with the lowest mortality risk and lowest incidence of weight-related diseases.
BMI: Body Mass Index (weight/height²)
Normal Weight: BMI 18.5-24.9 range
WHO: World Health Organization standards
• Normal: 18.5-24.9
• Underweight: < 18.5
• Overweight: 25.0-29.9
• Remember 18.5-24.9 as healthy range
• Use online calculators for accuracy
• Consider limitations
• Confusing the ranges
• Using incorrect units
• Not accounting for limitations
Calculate the BMI for a person who is 70 kg and 170 cm tall. Show all steps of the calculation and interpret the result. Include both the metric and imperial formulas.
Metric Calculation:
Formula: BMI = Weight(kg) / Height(m)²
Step 1: Convert height to meters: 170 cm = 1.70 m
Step 2: Square the height: 1.70² = 2.89 m²
Step 3: Divide weight by squared height: 70 kg / 2.89 m² = 24.2
Imperial Calculation:
Formula: BMI = Weight(lbs) × 703 / Height(in)²
Step 1: Convert to imperial: 70 kg ≈ 154 lbs, 170 cm ≈ 66.9 inches
Step 2: Square the height: 66.9² = 4,475.6 inches²
Step 3: Apply formula: (154 × 703) / 4,475.6 = 24.2
Interpretation: BMI of 24.2 falls in the "Normal Weight" category (18.5-24.9), indicating a healthy weight for this height.
This calculation demonstrates the importance of unit conversion in BMI calculations. The metric formula is simpler (just divide by meters squared), while the imperial formula includes the conversion factor 703. Both formulas yield the same result when calculated correctly. The 703 factor accounts for converting pounds to kilograms and inches to meters.
Conversion Factor: 703 for imperial calculations
Metric System: Kilograms and meters
Imperial System: Pounds and inches
• Metric: BMI = kg/m²
• Imperial: BMI = (lbs×703)/in²
• Convert units properly
• Use metric system when possible
• Double-check unit conversions
• Verify with online calculators
• Forgetting to square height
• Using wrong conversion factor
• Mixing metric and imperial units
An athlete weighs 85 kg and is 180 cm tall. Their BMI is 26.2, which places them in the "Overweight" category. Explain why BMI might not accurately reflect their health status and what additional measurements could provide better insight into their health.
Why BMI is Misleading for Athletes:
1. Muscle vs. Fat: BMI doesn't distinguish between muscle mass and fat mass. Athletes typically have higher muscle mass, which weighs more than fat.
2. Body Composition: A muscular athlete may have a high BMI but low body fat percentage.
3. Density: Muscle tissue is denser than fat tissue.
Better Assessment Tools:
• Body Fat Percentage: Direct measure of fat vs. lean mass
• Waist Circumference: Assesses abdominal fat distribution
• Dual-energy X-ray absorptiometry (DEXA): Gold standard for body composition
• Bioelectrical Impedance: Estimates body fat percentage
• Waist-to-Hip Ratio: Assesses fat distribution pattern
In this case, the athlete may have excellent health markers despite the "overweight" BMI classification.
This example illustrates one of the most significant limitations of BMI: its inability to distinguish between muscle and fat mass. Athletes and very muscular individuals often have BMIs in the overweight or obese range despite being metabolically healthy. This demonstrates why BMI should be used as a screening tool rather than a definitive health assessment.
Body Composition: Proportions of fat and lean mass
Muscle Mass: Lean body tissue
Body Fat Percentage: Proportion of fat in body
• BMI doesn't distinguish muscle from fat
• Consider body composition
• Use multiple health indicators
• Consider fitness level
• Use body composition tools
• Assess metabolic markers
• Relying solely on BMI
• Not considering muscle mass
• Ignoring other health markers
Compare the health implications of two individuals with identical BMIs of 28.5: Person A is sedentary with central obesity (apple-shaped), and Person B is physically active with peripheral fat distribution (pear-shaped). Explain why their health risks might differ despite having the same BMI.
Health Risk Differences:
Person A (Central Obesity):
• Higher visceral fat around organs
• Increased risk of metabolic syndrome
• Higher cardiovascular disease risk
• Greater insulin resistance
• Elevated inflammatory markers
Person B (Peripheral Fat):
• Subcutaneous fat distribution
• Lower visceral organ impact
• Better metabolic profile
• Lower cardiovascular risk
• More favorable inflammatory markers
Physical Activity Impact:
Person B's activity level likely provides cardiovascular benefits, improved insulin sensitivity, and better overall metabolic health, despite the same BMI as Person A.
This example demonstrates another critical limitation of BMI: it doesn't account for fat distribution. Central obesity (visceral fat around organs) is much more harmful than peripheral fat (subcutaneous fat). This is why waist circumference and waist-to-hip ratio are important complementary measures to BMI for assessing health risks.
Visceral Fat: Fat around internal organs
Subcutaneous Fat: Fat under the skin
Central Obesity: Apple-shaped fat distribution
• Fat distribution matters
• Central obesity is riskier
• Consider activity levels
• Measure waist circumference
• Assess activity levels
• Consider metabolic markers
• Not considering fat distribution
• Ignoring activity levels
• Assuming same risks with same BMI
Which of the following is NOT a recognized limitation of BMI?
Option C is NOT a limitation of BMI—it's actually stating that BMI always accurately predicts health risks, which is incorrect. BMI does NOT always accurately predict health risks, which is precisely why it's considered a limitation. BMI is a screening tool, not a diagnostic tool, and should be interpreted alongside other health indicators.
All other options (A, B, D) are recognized limitations of BMI.
The answer is C) Always accurately predicts health risks.
This question tests understanding of BMI limitations by presenting a false statement as an option. BMI is well-known to have several limitations, including inability to distinguish muscle from fat, not accounting for fat distribution, and varying applicability across different populations. The fact that BMI doesn't always accurately predict health risks is itself a limitation, not a strength.
Screening Tool: Used to identify potential issues
Diagnostic Tool: Used to confirm conditions
Limitations: Factors that reduce accuracy
• BMI is a screening tool
• Has known limitations
• Should be combined with other measures
• Use BMI as one measure
• Consider multiple indicators
• Consult healthcare providers
• Treating BMI as definitive
• Ignoring limitations
• Not considering other factors
FAQ
Q: My BMI is 27 but I'm very muscular. Is this concerning?
A: BMI may not be accurate for muscular individuals. Since muscle weighs more than fat, athletes often have higher BMIs despite low body fat percentages. For muscular individuals:
• Body fat percentage: More accurate indicator of health
• Dual-energy X-ray absorptiometry (DEXA): Gold standard for body composition
• Waist circumference: Assesses abdominal fat
• Metabolic markers: Blood lipids, glucose, etc.
Your BMI of 27 may not reflect increased health risks if you have low body fat and good metabolic markers. Consider getting a comprehensive body composition analysis.
Q: How does BMI change with age?
A: BMI interpretation can change with age:
• Older adults: Some studies suggest slightly higher BMIs (25-27) may be associated with better outcomes in seniors
• Muscle loss: Sarcopenia can affect BMI interpretation
• Bone density: Osteoporosis can affect weight
• Metabolic changes: Slower metabolism affects weight distribution
• Frailty: Very low BMI can indicate frailty in seniors
For older adults, BMI should be interpreted alongside functional capacity, muscle mass, and overall health status.
Q: How is BMI different for children?
A: BMI for children is calculated the same way but interpreted differently:
• Percentiles: Compared to age and sex-specific growth charts
• Underweight: Below 5th percentile
• Healthy weight: 5th to 85th percentile
• Overweight: 85th to 95th percentile
• Obese: At or above 95th percentile
Children's BMI changes as they grow and develop. Percentile rankings account for normal variations in growth patterns. Always consult pediatricians for interpretation of children's BMI.