Integrating Sustainability Metrics into Digital Operations
Complete guide to Industry 4.0 sustainability • Step-by-step explanations
Sustainability Integration:
Show Sustainability CalculatorIntegrating sustainability metrics into digital operations enables manufacturers to track, analyze, and optimize their environmental impact in real-time. This comprehensive approach combines IoT sensors, data analytics, and reporting systems to create a holistic view of sustainability performance across manufacturing processes.
Key sustainability concepts:
- Carbon Footprint: Measuring greenhouse gas emissions
- Energy Efficiency: Optimizing power consumption
- Waste Reduction: Minimizing material waste
- Water Conservation: Efficient water usage
Modern sustainability systems leverage digital twins, AI analytics, and predictive modeling to optimize environmental performance while maintaining operational efficiency and profitability.
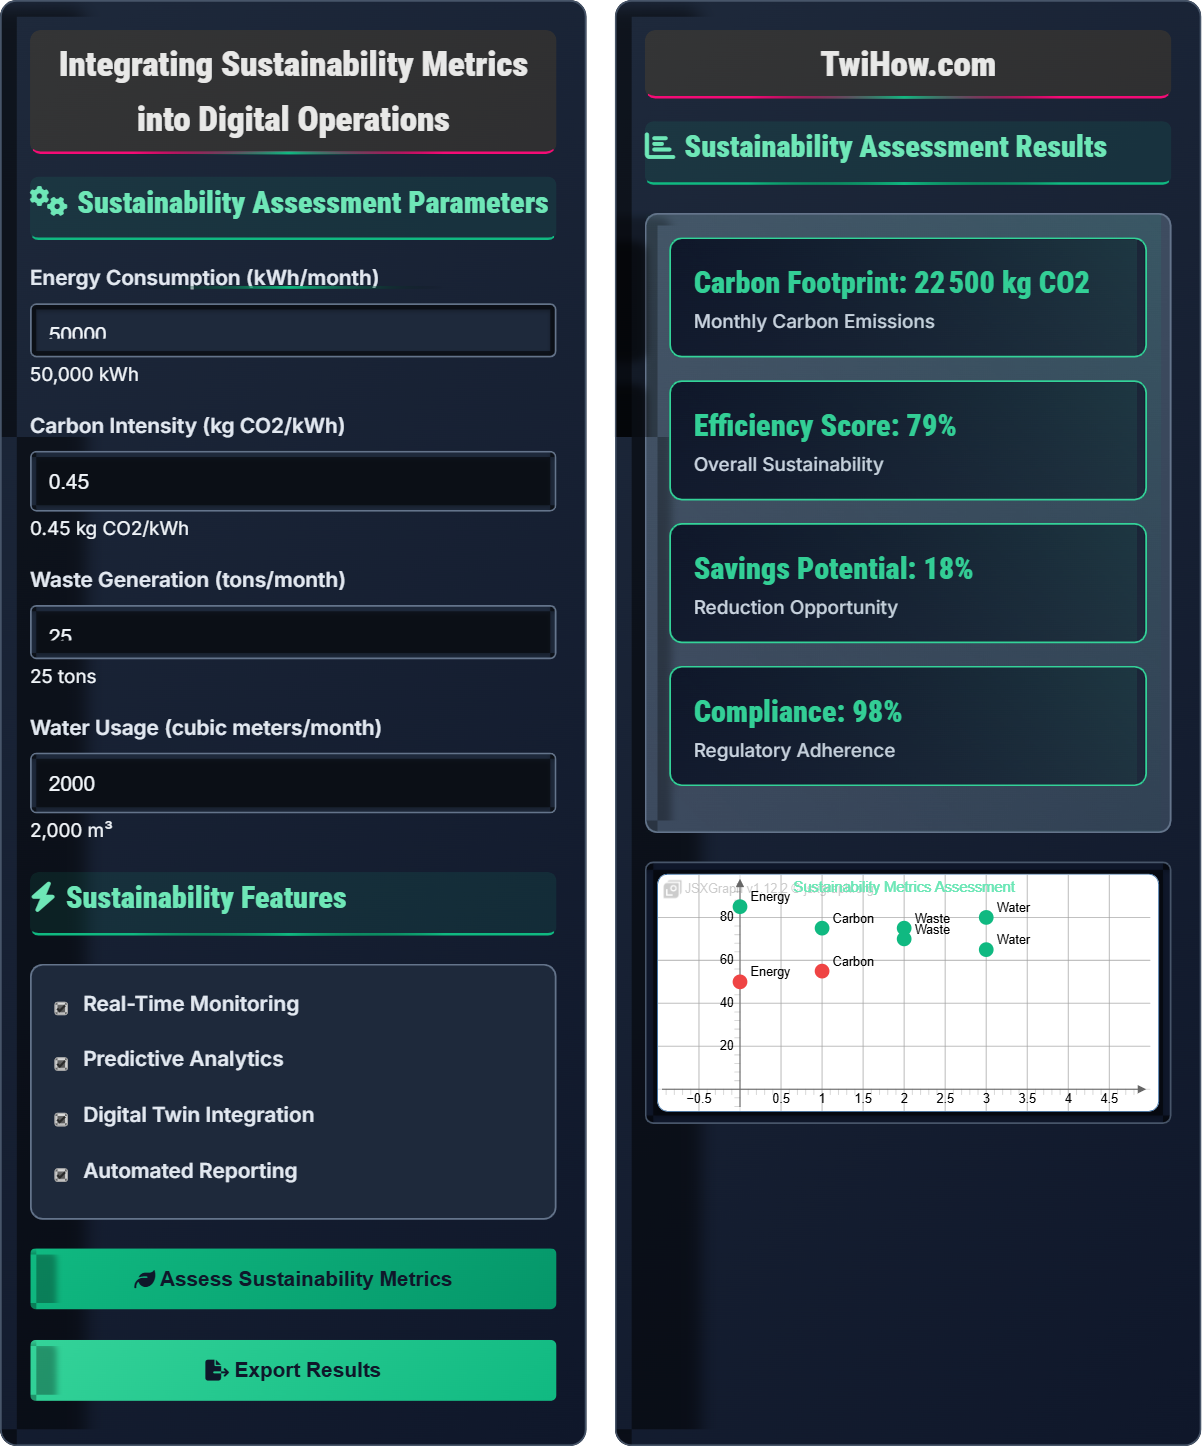
Sustainability Assessment Parameters
Sustainability Features
Sustainability Assessment Results
| Environmental Metric | Current Value | Target | Status |
|---|---|---|---|
| Energy Efficiency | 85% | 90% | Good |
| Carbon Intensity | 0.45 kg/kWh | 0.40 kg/kWh | Average |
| Waste Reduction | 75% | 80% | Good |
| Water Conservation | 60% | 70% | Average |
• Optimize equipment efficiency
• Renewable energy sources
• Smart grid integration
• Circular economy
• Material recovery
• Process optimization
• Recycling systems
• Leak detection
• Efficient processes
Integrating Sustainability Metrics into Digital Operations
Sustainability integration involves embedding environmental performance metrics into digital operations systems to enable real-time monitoring, analysis, and optimization of environmental impact. This approach combines IoT sensors, data analytics, and reporting systems to create a comprehensive view of sustainability performance across manufacturing processes.
Key sustainability metrics include:
- Carbon Footprint: Measuring greenhouse gas emissions across operations
- Energy Efficiency: Optimizing power consumption and utilization
- Waste Reduction: Minimizing material waste and promoting circular economy
- Water Conservation: Efficient water usage and recycling
- Resource Optimization: Maximizing material utilization efficiency
Sustainability metrics can be calculated using various formulas that combine operational data with environmental impact factors. The overall sustainability score represents a weighted combination of different environmental factors.
Where:
- Energy Consumption: Total energy used in operations (kWh)
- Carbon Intensity Factor: Emissions per unit of energy (kg CO2/kWh)
- Carbon Footprint: Total greenhouse gas emissions (kg CO2)
Technologies that enable sustainability integration in digital operations:
- IoT Sensors: Real-time environmental data collection
- Cloud Analytics: Scalable data processing and analysis
- Digital Twins: Virtual models for sustainability optimization
- AI/ML: Predictive analytics for environmental performance
- Blockchain: Transparent sustainability reporting and verification
- Edge Computing: Real-time processing at point of data collection
- Predictive Maintenance: Reduce waste through optimized equipment performance
- Smart Manufacturing: Optimize production for minimal environmental impact
- Circular Economy: Maximize resource utilization and recycling
- Renewable Energy Integration: Optimize renewable energy usage
- Supply Chain Optimization: Reduce transportation and logistics emissions
- Life Cycle Assessment: Comprehensive environmental impact analysis
Sustainability Fundamentals
Sustainability metrics, environmental impact assessment, carbon footprint, energy efficiency, circular economy, digital operations.
Carbon Footprint = Energy Consumption × Carbon Intensity Factor
Where Carbon Footprint = total greenhouse gas emissions, Energy Consumption = total energy used.
- Measure what you want to manage
- Integrate sustainability into operational KPIs
- Report transparently to stakeholders
Applications
Smart factory sustainability, carbon footprint tracking, energy management, waste optimization, water conservation.
- Automotive manufacturing sustainability
- Chemical plant environmental monitoring
- Food processing waste reduction
- Textile industry water conservation
- Regulatory compliance requirements
- Stakeholder reporting obligations
- Cost-benefit analysis of sustainability investments
- Integration with existing systems
Sustainability Learning Quiz
Which formula correctly calculates the carbon footprint of a manufacturing process?
The correct formula is Carbon Footprint = Energy Consumption × Carbon Intensity Factor. This multiplies the total energy consumed by the emission factor to get the total greenhouse gas emissions.
For example, if a facility consumes 10,000 kWh and the carbon intensity is 0.5 kg CO2/kWh, the carbon footprint is 5,000 kg CO2.
The answer is A) Carbon Footprint = Energy Consumption × Carbon Intensity Factor.
Carbon footprint calculation is fundamental to environmental management. The carbon intensity factor represents the amount of CO2 emitted per unit of energy consumed, which varies by energy source (coal, natural gas, renewables). Multiplication is used because we're calculating the cumulative effect of energy usage across the entire operation.
Carbon Footprint: Total greenhouse gas emissions caused by an activity
Carbon Intensity: Emissions per unit of energy consumed
Greenhouse Gases: Gases that trap heat in the atmosphere
• Always multiply energy by intensity factor
• Use consistent units across calculations
• Consider all sources of emissions
• Keep detailed energy consumption records
• Update carbon intensity factors regularly
• Include indirect emissions in calculations
• Adding instead of multiplying factors
• Using inconsistent units
• Ignoring indirect emissions
Explain how IoT sensors contribute to sustainability metrics integration in digital operations. Include specific examples of environmental parameters that can be monitored and how this data supports sustainability goals.
IoT Sensor Contributions to Sustainability:
1. Energy Monitoring: Smart meters and power sensors track electricity, gas, and steam consumption in real-time, enabling identification of inefficiencies and optimization opportunities.
2. Environmental Parameters: Temperature, humidity, and air quality sensors help optimize HVAC systems for energy efficiency while maintaining safe working conditions.
3. Water Management: Flow meters and quality sensors monitor water usage, detect leaks, and optimize recycling systems.
4. Waste Tracking: Weight sensors and material flow monitors track waste generation and recycling rates.
5. Equipment Efficiency: Vibration, temperature, and pressure sensors indicate equipment performance and maintenance needs, preventing energy waste from inefficient operations.
Examples of Environmental Parameters:
• Power consumption (kW) at equipment level
• Water flow rates (m³/hour) in cooling systems
• Air emissions (ppm) from exhaust stacks
• Temperature (°C) in heating/cooling processes
• Material waste (kg) per production unit
IoT sensors transform sustainability from a reactive to a proactive discipline by providing real-time data on environmental impacts. The granularity of data allows for precise optimization of processes, identification of waste, and measurement of improvement initiatives. Without accurate measurement, meaningful sustainability improvements are difficult to achieve.
IoT (Internet of Things): Network of connected devices that collect and share data
Sensor: Device that detects and responds to environmental changes
Real-Time Monitoring: Continuous data collection and analysis
• Deploy sensors at critical environmental impact points
• Integrate sensor data with operational systems
• Start with high-impact, low-cost monitoring points
• Use wireless sensors for difficult installations
• Implement edge computing for real-time responses
• Installing sensors without clear objectives
• Not calibrating sensors regularly
• Failing to integrate data into decision-making
A manufacturing facility consumes 100,000 kWh per month with a carbon intensity of 0.5 kg CO2/kWh, resulting in 50,000 kg of CO2 emissions. If they implement energy efficiency measures that reduce consumption by 15%, calculate the new energy consumption, carbon footprint, and the amount of CO2 emissions avoided. What percentage reduction in carbon footprint does this represent?
Original Values:
Energy Consumption = 100,000 kWh
Carbon Intensity = 0.5 kg CO2/kWh
Original Carbon Footprint = 100,000 × 0.5 = 50,000 kg CO2
After 15% Reduction:
New Energy Consumption = 100,000 × (1 - 0.15) = 85,000 kWh
New Carbon Footprint = 85,000 × 0.5 = 42,500 kg CO2
CO2 Avoided = 50,000 - 42,500 = 7,500 kg CO2
Percentage Reduction = (7,500 / 50,000) × 100 = 15%
Conclusion: A 15% reduction in energy consumption results in a 15% reduction in carbon footprint, avoiding 7,500 kg of CO2 emissions monthly.
This calculation demonstrates the direct relationship between energy consumption and carbon emissions. When carbon intensity remains constant, the percentage reduction in energy consumption equals the percentage reduction in carbon footprint. This linear relationship makes energy efficiency a primary focus for carbon reduction strategies.
Energy Efficiency: Using less energy to perform the same function
Carbon Reduction: Decreasing greenhouse gas emissions
Direct Relationship: Proportional change between variables
• Energy efficiency directly reduces carbon footprint
• Calculate both absolute and percentage reductions
• Track improvements over time
• Set baseline measurements before improvements
• Monitor multiple metrics simultaneously
• Calculate ROI for efficiency investments
• Not accounting for carbon intensity changes
• Failing to measure baseline values
• Not considering seasonal variations
A manufacturing company wants to use a digital twin to optimize their environmental performance. Describe how a digital twin can be used to improve sustainability metrics and provide specific examples of environmental optimizations that can be tested virtually before implementation.
How Digital Twins Improve Sustainability:
1. Process Simulation: Model different production scenarios to identify the most energy-efficient sequences and reduce waste.
2. Equipment Optimization: Simulate optimal operating parameters for machinery to minimize energy consumption while maintaining output.
3> Resource Planning: Optimize material usage and waste generation through virtual testing of different production methods.
4. Predictive Maintenance: Simulate equipment degradation to schedule maintenance optimally, preventing energy waste from inefficient operation.
Specific Environmental Optimizations:
• Heating Systems: Test optimal temperature settings and timing to reduce energy consumption
• Production Scheduling: Optimize production runs to minimize equipment startup/shutdown cycles
• Material Flow: Design layouts that minimize transport distances and energy use
• Water Recycling: Model closed-loop water systems to maximize reuse
• Waste Sorting: Optimize sorting processes to increase recycling rates
Digital twins enable "what-if" analysis for sustainability without risking actual operations. Manufacturers can test environmental improvements virtually, quantify benefits, and optimize implementations before deploying to real systems. This approach reduces the risk and cost associated with sustainability initiatives while maximizing their effectiveness.
Digital Twin: Virtual replica of physical system or process
Virtual Testing: Experimentation in digital environment
Process Optimization: Improving efficiency of operations
• Validate digital twin accuracy with real data
• Include environmental parameters in twin models
• Test optimizations before implementation
• Start with high-impact processes first
• Include all relevant environmental metrics
• Regularly update twin models with new data
• Creating inaccurate digital twin models
• Not including environmental parameters
• Failing to validate virtual results
Which of the following is the most comprehensive approach to sustainability reporting in digital operations?
Real-time dashboard with multiple environmental metrics is the most comprehensive approach to sustainability reporting. This provides continuous visibility into various environmental impacts, enables immediate corrective actions, and supports data-driven decision making.
Real-time dashboards allow for: immediate identification of anomalies, trend analysis, correlation between different metrics, and proactive management of environmental performance.
The answer is B) Real-time dashboard with multiple environmental metrics.
Comprehensive sustainability reporting requires multiple metrics displayed in real-time to capture the full environmental impact of operations. Single-metric reporting or infrequent reporting limits the ability to identify and respond to environmental issues promptly. Real-time dashboards enable operational teams to make immediate adjustments when environmental performance deviates from targets.
Real-Time Dashboard: Live display of current performance metrics
Environmental Metrics: Quantifiable measures of environmental impact
Comprehensive Reporting: Complete view of all relevant metrics
• Include multiple environmental metrics
• Provide real-time visibility
• Enable actionable insights
• Include trend analysis capabilities
• Set up automated alerts for thresholds
• Make dashboards accessible to all stakeholders
• Focusing on single metrics only
• Providing delayed reporting
• Not making data actionable
FAQ
Q: How do you balance sustainability goals with operational efficiency and profitability?
A: Balancing sustainability with efficiency and profitability requires integrated thinking:
1. Identify Win-Win Opportunities: Many sustainability initiatives also reduce costs (energy efficiency, waste reduction)
2. Measure True Costs: Include environmental costs in operational metrics
3. Stakeholder Alignment: Communicate long-term value of sustainability investments
4. Phased Implementation: Start with high-ROI sustainability projects
5. Continuous Improvement: Use sustainability metrics to drive operational excellence
Q: What are the key regulatory considerations for sustainability reporting in manufacturing?
A: Key regulatory considerations include:
Global Standards: ISO 14001 (Environmental Management), ISO 50001 (Energy Management)
Regional Regulations: EU Emissions Trading System, US EPA reporting requirements
Corporate Mandates: SEC climate disclosure rules, TCFD recommendations
Local Requirements: State-level environmental reporting, permit conditions
Industry-Specific: Sector-specific sustainability reporting standards
Companies must stay current with evolving regulations and ensure data accuracy for compliance.