Real-Time Analytics for Continuous Improvement in Manufacturing
Complete Manufacturing Analytics Guide • Step-by-step explanations
Manufacturing Analytics Fundamentals:
Show Analytics DashboardReal-time analytics in manufacturing involves the continuous collection, processing, and analysis of production data to drive immediate decision-making and continuous improvement. This approach enables manufacturers to identify bottlenecks, optimize processes, and respond quickly to issues before they impact quality or efficiency.
Key components include data collection from sensors and systems, real-time processing, visualization dashboards, and automated alerts. These systems transform raw data into actionable insights that drive operational excellence.
Key concepts:
- KPI Monitoring: Real-time tracking of Overall Equipment Effectiveness (OEE), throughput, quality metrics
- Root Cause Analysis: Identifying the source of problems instantly
- Predictive Maintenance: Preventing equipment failures before they occur
- Process Optimization: Continuous adjustments based on live data
Successful implementation requires integration of shop floor systems, robust data infrastructure, and a culture of data-driven decision making throughout the organization.
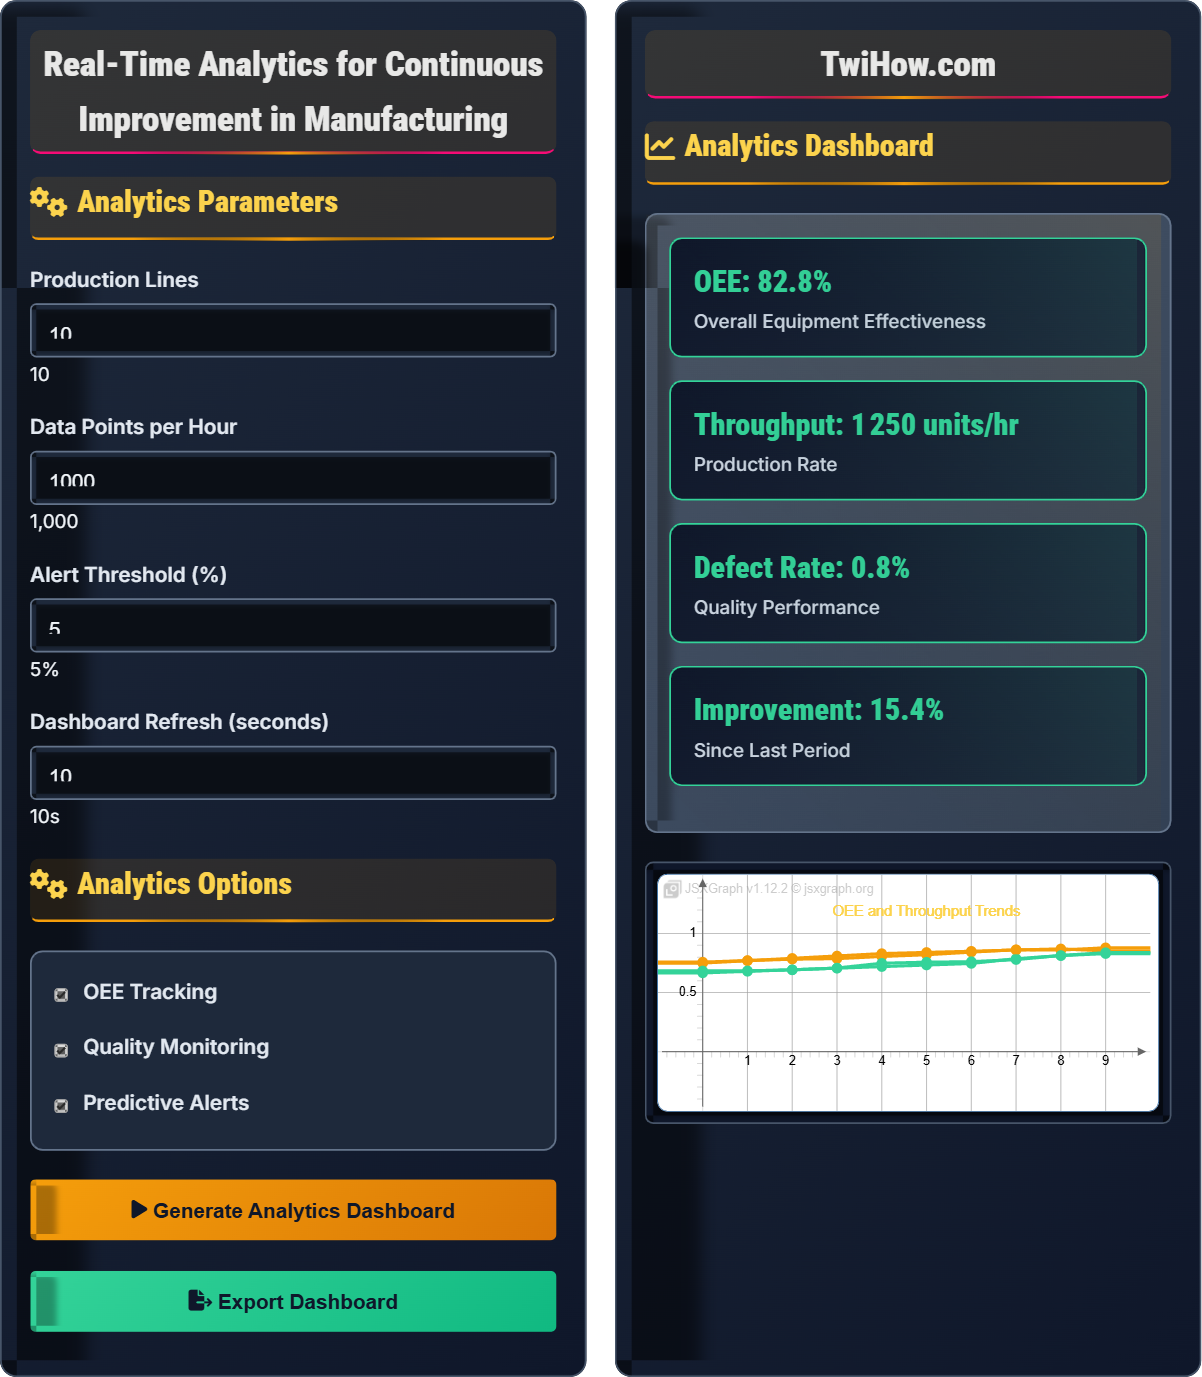
Analytics Parameters
Analytics Options
Analytics Dashboard
| Line | OEE | Availability | Performance | Quality |
|---|---|---|---|---|
| Line 1 | 87% | 92% | 94% | 98% |
| Line 2 | 82% | 88% | 91% | 96% |
| Line 3 | 90% | 95% | 96% | 98% |
| Line 4 | 78% | 85% | 88% | 94% |
| Line 5 | 89% | 93% | 95% | 97% |
Real-Time Analytics for Continuous Improvement Explained
Real-time analytics in manufacturing involves the continuous collection, processing, and analysis of production data to enable immediate decision-making and continuous improvement. This approach allows manufacturers to monitor key performance indicators (KPIs), identify bottlenecks, track quality metrics, and respond to issues as they occur, rather than after the fact. The system collects data from sensors, machines, and human operators to provide a comprehensive view of the production process in real-time.
The OEE metric combines three key factors to measure manufacturing productivity:
Where:
- Availability: Actual operating time / Planned production time
- Performance: Actual cycle time / Ideal cycle time
- Quality: Good units produced / Total units started
- OEE: Overall measure of manufacturing effectiveness
Essential metrics for real-time manufacturing analytics:
- OEE: Overall Equipment Effectiveness measuring productivity
- Throughput: Units produced per time period
- Defect Rate: Percentage of defective products
- MTBF: Mean Time Between Failures for equipment reliability
- Changeover Time: Time to switch between product types
- Energy Efficiency: Resource consumption per unit produced
- Immediate Issue Detection: Identify problems before they escalate
- Proactive Maintenance: Schedule repairs based on actual conditions
- Optimized Production: Adjust processes for maximum efficiency
- Improved Quality: Catch defects early in the process
- Reduced Waste: Minimize material and energy waste
- Better Decision Making: Data-driven insights for management
Manufacturing Analytics Fundamentals
Real-time analytics, OEE, KPIs, data visualization, continuous improvement, predictive maintenance.
OEE = Availability × Performance × Quality
Where OEE = Overall Equipment Effectiveness measuring manufacturing productivity.
- Data accuracy is critical for reliable analytics
- Real-time visibility enables faster responses
- Continuous monitoring drives sustained improvement
Applications
Production monitoring, quality control, predictive maintenance, bottleneck identification, resource optimization.
- Automotive assembly lines
- Electronics manufacturing
- Food and beverage processing
- Pharmaceutical production
- Data security and privacy
- System integration complexity
- Staff training requirements
- Initial investment costs
Manufacturing Analytics Learning Quiz
Which of the following is NOT a component of Overall Equipment Effectiveness (OEE)?
OEE is composed of three factors: Availability (actual operating time vs. planned time), Performance (actual vs. ideal cycle time), and Quality (good units vs. total units produced). Inventory level is not part of the OEE calculation, though it may be a related metric in manufacturing analytics.
The answer is D) Inventory Level.
The OEE formula multiplies three independent factors to give a comprehensive measure of manufacturing efficiency. Each factor represents a different aspect of production: availability addresses downtime, performance addresses speed losses, and quality addresses defect rates. Understanding these components helps identify specific areas for improvement rather than just looking at overall productivity.
Availability: Actual operating time divided by planned production time
Performance: Actual cycle time compared to ideal cycle time
Quality: Good units produced divided by total units started
• OEE = Availability × Performance × Quality
• Each component must be calculated separately
• OEE ranges from 0% to 100%
• Focus improvement efforts on the lowest component
• Track OEE components separately for targeted actions
• Benchmark against industry standards (typically 85% is world-class)
• Including breaks and lunch in planned production time
• Using theoretical vs. actual ideal cycle times
• Counting rework as good units in quality calculation
Describe the process of implementing real-time analytics for continuous improvement in a manufacturing facility. What are the key steps, challenges, and expected outcomes?
Implementation Process: Begin with data inventory to identify available sources, then install necessary sensors and connectivity infrastructure. Develop data collection protocols, establish real-time processing capabilities, and create visualization dashboards.
Key Steps: 1) Define KPIs and targets, 2) Install data collection systems, 3) Configure analytics platform, 4) Train staff on dashboard usage, 5) Establish alert thresholds, 6) Implement feedback loops.
Challenges: Data quality issues, system integration complexity, staff resistance, cybersecurity concerns, initial investment costs.
Outcomes: Reduced downtime, improved quality, optimized throughput, predictive maintenance, data-driven decision making.
Implementing real-time analytics is a comprehensive transformation that touches every aspect of manufacturing operations. Success requires careful planning, stakeholder buy-in, and phased implementation. The process typically begins with a pilot project to demonstrate value before expanding to the entire facility. Change management is crucial as the system fundamentally alters how operations are monitored and managed.
Key Performance Indicator (KPI): Measurable value that demonstrates performance
Data Lake: Repository for large volumes of raw data
Edge Computing: Processing data near its source for low latencyChange Management: Structured approach to transitioning individuals and organizations
• Start with critical processes for maximum impact
• Ensure data quality before implementation
• Involve operators in system design
• Begin with a single production line as a pilot
• Use standardized data formats for easier integration
• Establish clear ownership for each KPI
• Attempting enterprise-wide implementation immediately
• Not validating data accuracy before use
• Creating dashboards without operator input
A electronics manufacturing company operates 20 production lines with an average OEE of 75%. After implementing real-time analytics, they achieve the following improvements: availability increases by 8%, performance improves by 5%, and quality rises by 3%. Calculate the new OEE and estimate the annual production increase if each line produces 1,000 units per day and operates 300 days per year.
Original OEE Components: Assuming equal distribution, each component was approximately 91% (since 0.91³ ≈ 0.75)
New Components: Availability: 91% + 8% = 99%, Performance: 91% + 5% = 96%, Quality: 91% + 3% = 94%
New OEE: 0.99 × 0.96 × 0.94 = 0.894 = 89.4%
Production Increase: Original: 20 lines × 1,000 units/day × 300 days = 6,000,000 units/year. New: 6,000,000 × (89.4/75) = 7,152,000 units/year. Increase: 1,152,000 units/year.
This example demonstrates the multiplicative effect of OEE components and the significant impact of real-time analytics on production capacity. Small improvements in each component compound to create substantial overall gains. The calculation shows how analytics-driven improvements translate directly to increased revenue potential and competitive advantage.
Overall Equipment Effectiveness (OEE): Comprehensive measure of manufacturing productivity
Capacity Utilization: Percentage of potential output being achieved
Productivity Gain: Increase in output per unit of input
• OEE components multiply together
• Small improvements compound significantly
• Baseline measurements are essential
• Focus on the lowest OEE component first
• Calculate financial impact of improvements
• Set realistic improvement targets
• Adding OEE components instead of multiplying
• Not accounting for compounding effects
• Setting unrealistic improvement expectations
A manufacturing facility generates 10,000 data points per hour across 15 production lines. With a standard alert threshold of 5% deviation from target, the system generates too many alerts, overwhelming operators. Propose three strategies to optimize alert management while maintaining effective monitoring.
Strategy 1 - Smart Alert Filtering: Implement algorithms that only trigger alerts for sustained deviations lasting more than 5 minutes, reducing noise from temporary fluctuations.
Strategy 2 - Tiered Alert System: Categorize alerts by severity (critical, warning, informational) and route them to appropriate personnel levels.
Strategy 3 - Trend-Based Alerts: Trigger alerts based on trend analysis rather than point-in-time deviations, identifying gradual deterioration before it becomes critical.
These approaches reduce alert fatigue while maintaining proactive monitoring capabilities.
Effective alert management is crucial for real-time analytics success. Too many alerts lead to alert fatigue where operators begin ignoring all notifications. The key is balancing sensitivity with usability, ensuring critical issues receive immediate attention while filtering out noise. This requires understanding normal variation patterns and setting appropriate thresholds based on statistical analysis.
Alert Fatigue: Desensitization to alerts due to excessive frequency
Statistical Process Control: Statistical methods for monitoring and controlling processes
False Positive: Alert triggered without actual problem occurrence
• Alerts should require specific actions
• Severity levels must be clearly defined
• Alert effectiveness should be regularly reviewed
• Use moving averages to smooth short-term variations
• Implement alert suppression during planned maintenance
• Regularly review and adjust thresholds based on performance
• Setting thresholds too low causing excessive alerts
• Not customizing alerts for different processes
• Failing to track alert resolution effectiveness
Which factor has the greatest impact on the return on investment (ROI) of real-time manufacturing analytics systems?
Operator engagement and adoption have the greatest impact on ROI because the system's value depends on people using the data to make decisions and take action. Even the most sophisticated analytics system provides no benefit if operators don't engage with it or fail to act on insights. The technology is only valuable when it drives behavioral change and process improvements.
The answer is C) Operator engagement and adoption.
Manufacturing analytics ROI depends on the system's ability to drive actionable insights that lead to measurable improvements. Technology alone doesn't create value; it's the combination of accurate data, insightful analysis, and human action that generates returns. Organizations that invest in change management and user adoption typically see significantly higher returns than those that focus only on technical implementation.
Return on Investment (ROI): Financial benefit relative to investment cost
User Adoption: Degree to which users accept and utilize a system
Change Management: Process of transitioning individuals and organizations
• Technology ROI depends on user behavior
• Training and support are critical for success
• Cultural change takes time and effort
• Involve operators in system design
• Demonstrate immediate value through pilot projects
• Recognize and reward data-driven improvements
• Focusing only on technical features
• Not investing in user training
• Assuming automatic user acceptance
FAQ
Q: How much improvement can we expect from real-time analytics?
A: Typical improvements from real-time analytics include: 5-15% increase in OEE, 10-25% reduction in unplanned downtime, 5-10% improvement in quality rates, and 15-30% reduction in maintenance costs. The exact impact depends on baseline performance, implementation quality, and organizational commitment to acting on insights. Companies starting with lower OEE typically see higher percentage improvements, while those already at high levels see smaller but still significant absolute gains.
Q: Will real-time analytics replace my role in monitoring equipment?
A: Real-time analytics enhances rather than replaces human operators. The system handles routine monitoring and alerts you to issues requiring attention. Your role evolves to focus on interpreting complex situations, making judgment calls, performing maintenance, and taking corrective actions. The analytics provide you with better information to make more informed decisions, ultimately making your job more efficient and impactful. The combination of human expertise and data insights creates better outcomes than either alone.