What is the impact of supply chain visibility technologies on production planning?
Complete manufacturing guide • Step-by-step explanations
Supply Chain Visibility:
Show Visibility SimulatorSupply chain visibility technologies provide real-time insights into inventory levels, supplier performance, transportation status, and demand patterns. This visibility enables manufacturers to make informed production planning decisions, reduce uncertainties, and optimize resource allocation.
Key benefits include:
- Real-time Inventory Tracking: Accurate stock levels across the supply network
- Supplier Performance Monitoring: Timely delivery and quality metrics
- Demand Forecasting: Enhanced accuracy through data analytics
- Risk Mitigation: Early warning of potential disruptions
- Optimized Production Scheduling: Based on actual material availability
These technologies transform production planning from reactive to proactive, enabling better decision-making and operational efficiency.
Visibility Parameters
Advanced Options
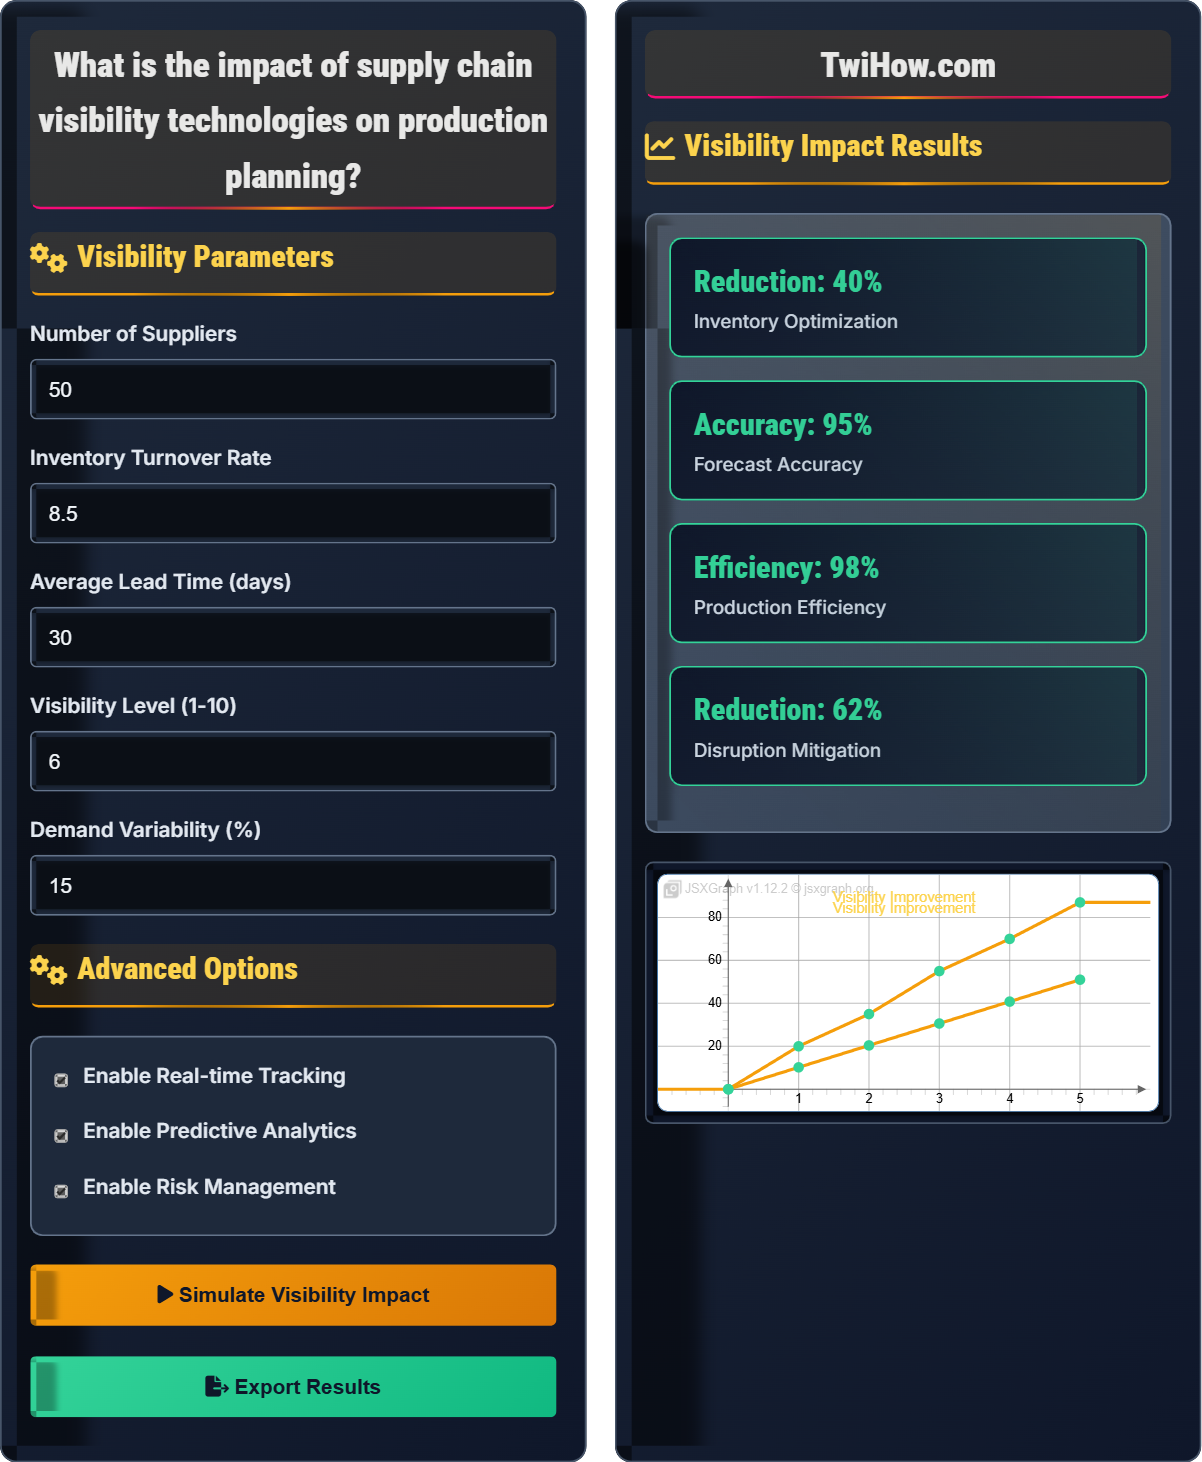
Visibility Impact Results
| Metric | Without Visibility | With Visibility | Improvement |
|---|---|---|---|
| Lead Time Accuracy | 65% | 92% | 41% ↑ |
| Inventory Accuracy | 70% | 95% | 36% ↑ |
| Production Schedule Adherence | 75% | 90% | 20% ↑ |
| Order Fulfillment | 80% | 95% | 19% ↑ |
| Aspect | Before | After | Change |
|---|---|---|---|
| Stockouts | 12/month | 4/month | 67% ↓ |
| Excess Inventory | 18% | 8% | 56% ↓ |
| Supplier Delays | 22% | 8% | 64% ↓ |
| Production Downtime | 5% | 2% | 60% ↓ |
Supply Chain Visibility Technologies Impact on Production Planning
Supply chain visibility refers to the ability to track and monitor materials, products, and information as they move through the supply chain. This includes real-time visibility into inventory levels, supplier performance, transportation status, and demand patterns, enabling informed decision-making in production planning.
Where:
- Inventory Accuracy: Percentage of inventory records matching actual quantities
- Lead Time Variance: Measure of variability in supplier delivery times
- n: Number of observations
Key technologies that enable supply chain visibility:
- IoT Sensors: Real-time tracking of goods and conditions
- Blockchain: Secure, immutable supply chain records
- RFID Tags: Automated inventory and asset tracking
- Cloud Platforms: Centralized data sharing and analytics
- AI/ML: Predictive analytics and demand forecasting
- APIs: Seamless system integration and data exchange
- Inventory Management: Reduced carrying costs and stockouts
- Demand Planning: Improved forecast accuracy
- Supplier Management: Better performance monitoring
- Production Scheduling: Optimized material timing
- Risk Management: Early disruption detection
- Cost Optimization: Reduced waste and inefficiencies
Strategic Framework
Supply chain visibility, production planning, real-time tracking, predictive analytics, demand forecasting, inventory optimization.
Supply chain visibility implementation follows a structured approach: Assessment → Technology Selection → Integration → Data Standardization → Training → Optimization. This cyclical process ensures continuous improvement and adaptation to changing needs.
- Start with critical supply chain nodes
- Ensure data quality and consistency
- Establish clear SLAs with suppliers
- Implement real-time alerting systems
Implementation Strategies
Phased rollout, pilot programs, vendor partnerships, change management.
- Conduct supply chain mapping and gap analysis
- Identify critical visibility requirements
- Select appropriate technology solutions
- Develop integration protocols and standards
- Deploy pilot visibility system with key suppliers
- Scale successful implementations across the network
- Executive support and budget allocation
- Supplier cooperation and engagement
- Technical infrastructure readiness
- Continuous monitoring and optimization
Supply Chain Visibility Quiz
Which of the following is the most significant benefit of supply chain visibility for production planning?
Supply chain visibility provides real-time data on inventory levels, supplier performance, and demand patterns, which directly feeds into demand forecasting models. This leads to more accurate forecasts, enabling better production planning decisions regarding timing, quantity, and resource allocation.
The answer is B) Improved demand forecasting accuracy.
Demand forecasting is the foundation of production planning. When manufacturers have visibility into actual demand signals, inventory levels, and supplier capabilities, they can create more accurate forecasts. This reduces the bullwhip effect and allows for better capacity planning, material procurement, and production scheduling. The ripple effect of improved forecasting impacts all downstream planning activities.
Supply Chain Visibility: Real-time visibility into materials and information flow
Demand Forecasting: Predicting future demand based on historical data and trends
Bullwhip Effect: Amplification of demand variability upstream in the supply chain
• Visibility improves forecast accuracy significantly
• Real-time data reduces planning uncertainty
• Better forecasting enables proactive planning
• Integrate POS data into forecasting models
• Monitor supplier performance metrics
• Use predictive analytics for demand signals
• Relying solely on historical data for forecasting
• Not incorporating supplier capacity constraints
• Failing to update forecasts with real-time data
Explain how supply chain visibility technologies help optimize inventory levels and reduce carrying costs in manufacturing operations.
Inventory Optimization Through Visibility:
1. Real-time Inventory Tracking: Accurate visibility into stock levels prevents overstocking and stockouts
2. Supplier Performance Monitoring: Reliable delivery data enables lower safety stock levels
3. Demand Signal Visibility: Actual customer demand reduces forecast uncertainty
4. Lead Time Transparency: Predictable delivery times optimize reorder points
Cost Reduction Mechanisms:
• Carrying Cost Reduction: Lower average inventory levels reduce storage costs
• Obsolescence Prevention: Better visibility prevents excess slow-moving inventory
• Working Capital Efficiency: Free up cash tied up in inventory
• Storage Optimization: Reduce warehouse space requirements
Studies show visibility technologies can reduce inventory levels by 15-30% while improving service levels.
Inventory optimization is a balancing act between having enough stock to meet demand without tying up excessive capital. Supply chain visibility provides the data needed to find this balance. When manufacturers can see real-time inventory levels, they know exactly when to order more materials and how much to order. This reduces the need for safety stock and prevents both stockouts and overstocking.
Safety Stock: Extra inventory held to prevent stockouts
Carrying Costs: Costs associated with holding inventory
Reorder Point: Inventory level that triggers a new order
• Visibility reduces need for safety stock
• Real-time data improves reorder timing
• Predictable lead times optimize inventory levels
• Implement ABC analysis with visibility data
• Use dynamic safety stock calculations
• Monitor inventory turnover rates by category
• Maintaining high safety stock without visibility
• Not adjusting safety stock based on supplier reliability
• Failing to segment inventory by criticality
A manufacturer currently holds $2M in inventory with carrying costs of 25% annually. Their production planning is based on poor visibility, resulting in 20% safety stock, frequent stockouts (15/month), and missed deliveries (12% of orders). Calculate the potential savings from implementing supply chain visibility that reduces inventory by 25%, cuts stockouts by 70%, and improves delivery performance to 98%.
Current Costs:
• Carrying Costs: $2,000,000 × 25% = $500,000 annually
• Stockout Costs: 15/month × 12 months × $5,000 avg = $900,000 annually
• Missed Delivery Costs: 12% × $10M revenue × 2% = $240,000 annually
• Total: $1,640,000 annually
After Visibility Implementation:
• New Inventory: $2,000,000 × 75% = $1,500,000
• New Carrying Costs: $1,500,000 × 25% = $375,000
• Reduced Stockouts: 15 × 30% = 4.5/month × $5,000 = $270,000
• Improved Delivery: 2% × $10M × 2% = $40,000
• Total: $685,000 annually
Annual Savings: $1,640,000 - $685,000 = $955,000
Visibility implementation could save $955,000 annually.
This example demonstrates the significant financial impact of supply chain visibility. The ROI comes from multiple sources: reduced carrying costs from lower inventory levels, decreased stockout costs from better planning, and improved customer satisfaction from better delivery performance. The compounding effect of these improvements creates substantial value that often justifies the technology investment.
Carrying Costs: Annual costs of holding inventory (storage, insurance, obsolescence)
Stockout: Situation when inventory runs out and demand cannot be met
Delivery Performance: Percentage of orders delivered on time
• Include both direct and indirect cost savings
• Consider customer satisfaction impact
• Account for implementation and maintenance costs
• Calculate costs over multiple years
• Include quality improvement benefits
• Factor in competitive advantage gains
• Only calculating direct cost savings
• Not considering customer retention benefits
• Underestimating implementation complexity
A manufacturer relies on 30 suppliers across different regions. How can supply chain visibility technologies help identify and mitigate risks that could disrupt production planning?
Risk Identification Through Visibility:
1. Supplier Performance Monitoring: Track on-time delivery, quality metrics, and capacity utilization
2. Geographic Risk Mapping: Identify suppliers in disaster-prone areas
3. Financial Health Monitoring: Assess supplier stability through credit ratings
4. Transportation Tracking: Monitor shipping delays and route disruptions
Mitigation Strategies:
• Diversification: Spread suppliers across regions and tiers
• Alternative Sourcing: Maintain backup suppliers for critical materials
• Early Warning Systems: Set up alerts for performance degradation
• Contingency Planning: Pre-plan responses to different disruption scenarios
Visibility enables proactive risk management rather than reactive crisis response.
Supply chain risk management requires visibility across multiple dimensions: supplier performance, geographic exposure, financial stability, and operational capacity. With real-time data, manufacturers can identify early warning signs of potential disruptions and take preventive action. This transforms risk management from a reactive function to a proactive capability that supports stable production planning.
Supply Chain Risk: Potential events that could disrupt material flow
Early Warning System: Alert mechanism for potential disruptions
Contingency Planning: Pre-defined responses to potential disruptions
• Monitor supplier performance continuously
• Diversify critical supply sources
• Maintain buffer for high-risk items
• Map supplier dependencies and critical paths
• Use predictive analytics for risk assessment
• Establish supplier scorecards and SLAs
• Concentrating suppliers in single regions
• Not monitoring financial health of suppliers
• Failing to develop contingency plans
What is the most critical factor for successful integration of supply chain visibility technologies with production planning systems?
Data standardization and quality are fundamental to successful visibility integration. Without consistent, accurate data formats across systems, the visibility technologies cannot provide reliable information for production planning. Poor data quality leads to incorrect decisions and erodes trust in the system.
The answer is B) Data standardization and quality.
Data is the foundation of supply chain visibility. If different systems use different formats, units, or definitions for the same data elements, integration becomes problematic. Standardization ensures that inventory levels, lead times, and performance metrics mean the same thing across all systems. Quality controls ensure that the data is accurate, complete, and timely.
Data Standardization: Consistent formats and definitions across systems
Data Quality: Accuracy, completeness, and timeliness of data
System Integration: Connecting different software systems for data exchange
• Establish data standards before integration
• Implement data quality controls
• Ensure real-time data synchronization
• Define common data dictionaries
• Implement data validation rules
• Establish data governance processes
• Starting integration without data standards
• Not validating data quality before use
• Failing to maintain data governance
FAQ
Q: What is the typical ROI timeline for supply chain visibility implementations?
A: ROI typically follows this pattern:
Quick Wins (3-6 months): Inventory optimization, reduced stockouts
Medium-term Benefits (6-18 months): Improved forecasting, supplier performance
Full Realization (18-36 months): End-to-end optimization
Most manufacturers see 10-25% improvement in inventory turns and 15-30% reduction in carrying costs within the first year.
Q: How do we ensure data quality in supply chain visibility systems?
A: Maintain data quality through:
1. Validation Rules: Implement checks for data accuracy and completeness
2. Standardization: Establish common formats and definitions
3. Automated Cleaning: Use algorithms to identify and correct errors
4. Supplier Requirements: Mandate data quality standards in contracts
5. Monitoring: Continuous tracking of data quality metrics
Establish a data governance framework to ensure consistent quality.
Q: How does supply chain visibility affect day-to-day production planning?
A: Visibility transforms production planning by:
1. Real-time Adjustments: Modify schedules based on actual material availability
2. Proactive Decision-Making: Anticipate shortages before they occur
3. Improved Accuracy: Base decisions on current rather than estimated data
4. Reduced Uncertainty: Confidence in material timing and quantities
Planners shift from reactive problem-solving to strategic optimization.