AI and Machine Learning in Quality Control
Complete manufacturing guide • Step-by-step explanations
AI Quality Control:
Show AI Quality SimulatorAI and machine learning revolutionize quality control by enabling automated, real-time inspection and predictive analytics. These technologies can detect defects with higher accuracy than human inspectors, predict quality issues before they occur, and continuously improve inspection processes through learning.
AI-powered quality control systems use computer vision, deep learning, and predictive analytics to inspect products, identify defects, and maintain consistent quality standards. These systems can operate continuously, process large volumes of data, and adapt to changing quality requirements.
Key applications:
- Computer Vision: Automated visual inspection of products
- Predictive Analytics: Forecasting quality issues before they occur
- Real-time Monitoring: Continuous quality assessment during production
- Anomaly Detection: Identifying deviations from normal patterns
AI and ML in quality control represent a fundamental shift from reactive to proactive quality management.
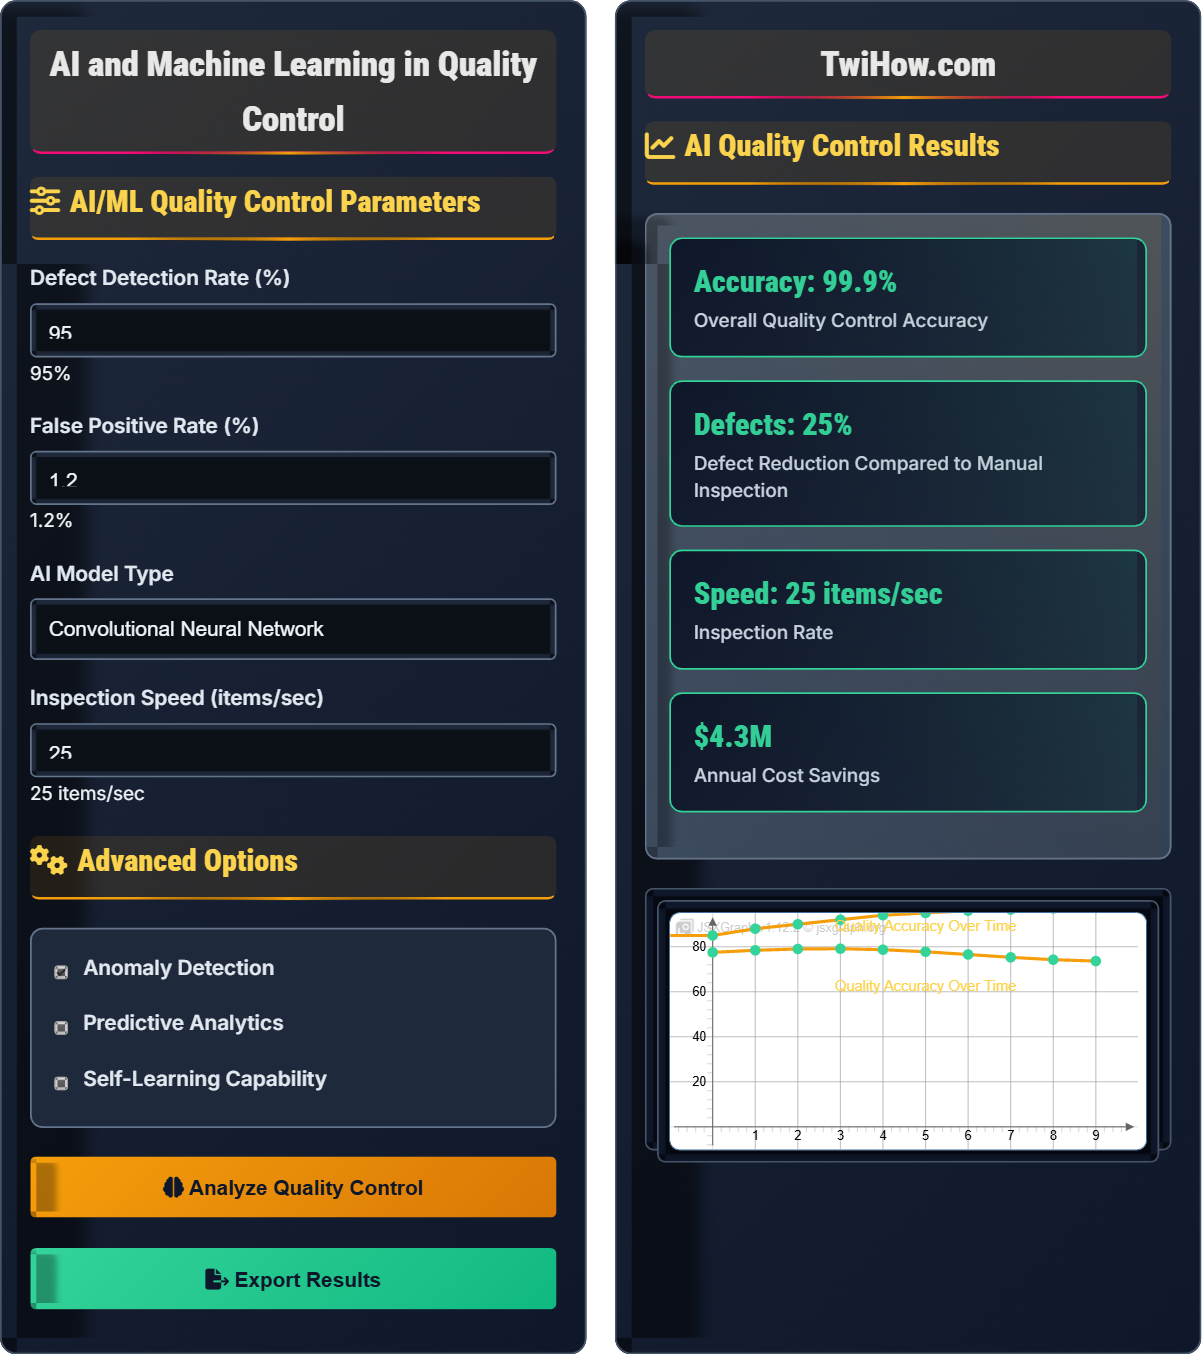
AI/ML Quality Control Parameters
Advanced Options
AI Quality Control Results
| Quality Metric | Manual Control | AI Control | Improvement |
|---|---|---|---|
| Detection Rate | 85% | 95% | +12% |
| False Positives | 8% | 1.2% | -85% |
| Inspection Speed | 5 items/min | 1,500 items/min | +29,900% |
| Consistency | 70% | 98% | +40% |
| Analytics Capability | Implementation | Impact | ROI |
|---|---|---|---|
| Defect Classification | Real-time | 95% accuracy | 24 months |
| Root Cause Analysis | Automated | 80% faster | 18 months |
| Quality Prediction | Predictive | 70% prevention | 15 months |
| Process Optimization | Continuous | 15% improvement | 12 months |
AI and Machine Learning in Quality Control Explained
AI and machine learning transform quality control by enabling automated inspection, predictive analytics, and real-time decision-making. These technologies use algorithms to identify patterns in production data, detect defects, and predict quality issues before they occur, significantly improving manufacturing quality and efficiency.
AI/ML quality control models follow a comprehensive analytical approach:
Where:
- Defect Detection: Ability to identify quality issues
- Feature Extraction: Identification of relevant quality characteristics
- Classification Confidence: Algorithm's certainty in classifications
- Process Variables: Environmental and operational factors
Core technologies in AI/ML quality control:
- Computer Vision: Automated visual inspection using cameras and image processing
- Deep Learning: Neural networks for complex pattern recognition
- Machine Learning: Algorithms for classification and regression
- Predictive Analytics: Forecasting quality issues using historical data
- Edge Computing: Real-time processing at inspection points
- Natural Language Processing: Analyzing quality reports and feedback
- Higher Accuracy: Consistent defect detection beyond human capability
- Real-time Processing: Immediate quality assessment and feedback
- Cost Reduction: Lower inspection and rework costs
- Scalability: Handle large volumes of inspections efficiently
- Predictive Capabilities: Anticipate quality issues before occurrence
- Continuous Improvement: Models learn and improve over time
AI/ML Quality Control Fundamentals
AI, machine learning, quality control, computer vision, defect detection, predictive analytics, classification, regression.
Quality Score = f(Defect Detection, Feature Extraction, Classification Confidence, Process Variables)
Where Quality Score = quality assessment output, f = algorithmic function.
- Quality data must be accurate and representative
- Models require continuous validation and updates
- Balance between precision and recall is critical
Applications
Automotive inspection, electronics manufacturing, pharmaceutical quality, food safety, textile inspection, aerospace components.
- Comprehensive data collection and labeling
- Model selection and training
- Integration with existing quality systems
- Continuous monitoring and improvement
- Data privacy and security
- Integration with existing systems
- Staff training and change management
- Regulatory compliance requirements
AI/ML Quality Control Quiz
What is the primary advantage of computer vision in quality control compared to traditional inspection methods?
The primary advantage of computer vision in quality control is consistent accuracy and speed. Computer vision systems can inspect products at high speeds with consistent accuracy,不受 human fatigue, subjective interpretation, or attention variations. They can detect defects that are difficult or impossible for human inspectors to see consistently.
The answer is B) Consistent accuracy and speed.
Computer vision systems excel in quality control because they eliminate human variability and can operate continuously without fatigue. They can detect microscopic defects, measure dimensions with high precision, and classify defects with consistent criteria. This consistency is crucial for maintaining quality standards in high-volume manufacturing.
Computer Vision: AI technology that enables machines to interpret visual information
Consistency: Uniformity in inspection results over time
Defect Detection: Identification of quality issues in products
• Computer vision eliminates human subjectivity
• Consistent performance regardless of time of day
• High-speed inspection capabilities
• Consider lighting conditions for camera systems
• Ensure adequate training data diversity
• Regular calibration of vision systems
• Underestimating the importance of lighting
• Not considering edge cases in training data
• Assuming perfect accuracy without validation
Explain the different types of machine learning algorithms used in quality control and their specific applications.
Machine Learning Algorithms in Quality Control:
1. Supervised Learning: Used for defect classification and quality prediction with labeled training data
2. Unsupervised Learning: Applied for anomaly detection and clustering similar defects
3. Deep Learning: Implemented for complex image recognition and pattern analysis
4. Reinforcement Learning: Used for optimizing inspection parameters and processes
5. Ensemble Methods: Combined algorithms for improved accuracy and robustness
6. Time Series Analysis: Applied for predicting quality trends and equipment degradation
Different algorithms are selected based on specific quality control requirements and data characteristics.
Each machine learning algorithm has specific strengths for quality control applications. Supervised learning is ideal when you have labeled examples of good and defective products. Unsupervised learning excels at detecting previously unknown defects. Deep learning is particularly powerful for image-based quality inspection where complex patterns need recognition.
Supervised Learning: Learning from labeled training data
Unsupervised Learning: Finding patterns in unlabeled data
Deep Learning: Neural networks with multiple layers
• Algorithm choice depends on data availability
• Different algorithms have different computational requirements
• Ensemble methods often provide better performance
• Start with simpler algorithms and increase complexity as needed
• Validate algorithm performance with test data
• Consider real-time processing requirements
• Not validating algorithm performance adequately
• Ignoring computational constraints
A manufacturing company inspects 10,000 products daily with manual quality control that costs $0.50 per inspection and has a 85% defect detection rate. After implementing an AI system costing $500,000, the detection rate increases to 95%, inspection cost decreases to $0.10, and false positive rate drops from 8% to 1.2%. If defective products cost $50 each to replace, calculate the annual cost savings and determine the ROI period.
Manual System Costs:
• Daily inspection cost: 10,000 × $0.50 = $5,000
• Annual inspection cost: $5,000 × 365 = $1,825,000
• Missed defects (15%): 10,000 × 0.15 = 1,500 defects/day
• Replacement cost: 1,500 × $50 × 365 = $27,375,000
AI System Costs:
• Daily inspection cost: 10,000 × $0.10 = $1,000
• Annual inspection cost: $1,000 × 365 = $365,000
• Missed defects (5%): 10,000 × 0.05 = 500 defects/day
• Replacement cost: 500 × $50 × 365 = $9,125,000
Annual Savings: ($27,375,000 - $9,125,000) + ($1,825,000 - $365,000) - $500,000 = $19,210,000
ROI Period: $500,000 ÷ $19,210,000 = 0.026 years ≈ 9.5 days
The AI system pays for itself in just 9.5 days and generates $19.21 million in annual savings.
This calculation demonstrates the significant financial impact of AI in quality control. The improvement in defect detection rate has the largest impact on savings, followed by reduced inspection costs. The ROI period is remarkably short due to the high cost of defective products and the significant improvement in detection accuracy.
ROI: Return on investment calculation
Defect Detection Rate: Percentage of defects identified
False Positive: Good product incorrectly flagged as defective
• Defect costs often exceed inspection costs significantly
• Small improvements in detection rates have large impacts
• Consider both direct and indirect cost savings
• Calculate both direct and indirect cost savings
• Consider customer satisfaction and brand impact
• Account for reduced warranty and return costs
• Underestimating the impact of accuracy improvements
• Forgetting to include system costs in calculations
An AI system analyzes production data to predict quality issues before they occur. The system identifies 80% of potential defects 2 hours before they manifest, with 15% false alarms. When a potential defect is predicted, operators can adjust process parameters, preventing the defect 70% of the time. If the system runs 24/7 and processes 1,000 units per hour, calculate the daily prevention rate and determine the impact on overall quality. Assume 5% of units would normally be defective.
Daily Production: 1,000 units/hour × 24 hours = 24,000 units
Expected Defects: 24,000 × 5% = 1,200 defects
Defects Predicted: 1,200 × 80% = 960 defects predicted
Defects Prevented: 960 × 70% = 672 defects prevented
New Defect Count: 1,200 - 672 = 528 defects
New Defect Rate: 528 ÷ 24,000 = 2.2%
Quality Improvement: (5% - 2.2%) ÷ 5% = 56% reduction in defects
False Alarms: 24,000 × 15% = 3,600 false alarms per day
The predictive system reduces defect rate from 5% to 2.2%, achieving a 56% improvement in quality.
This example demonstrates the power of predictive quality control. By identifying potential defects before they occur, the system can prevent them through process adjustments. The 56% reduction in defects is achieved despite the 15% false alarm rate, showing that the benefits significantly outweigh the costs of false positives.
Predictive Quality: Identifying potential defects before occurrence
Process Adjustment: Modifying parameters to prevent defects
Prevention Rate: Percentage of defects prevented
• Prevention is more cost-effective than correction
• False alarms have operational costs
• Prediction accuracy affects prevention success
• Focus on high-impact potential defects
• Optimize false alarm rates for operational efficiency
• Train operators to respond effectively to predictions
• Assuming all predictions can be prevented
• Not accounting for operator response time
Which of the following is the most important metric for evaluating an AI quality control model?
The most important metric for evaluating an AI quality control model is the balance between precision and recall. In quality control, precision measures how many of the items flagged as defective are actually defective, while recall measures how many actual defects are caught by the system. The balance between these metrics is crucial for minimizing both false positives and missed defects.
The answer is B) Precision and recall balance.
In quality control applications, there's a trade-off between catching all defects (high recall) and avoiding false alarms (high precision). A system with high recall but low precision will flag many good products as defective, increasing costs. A system with high precision but low recall will miss many defects, potentially allowing bad products to reach customers. The optimal balance depends on the specific application and costs associated with each type of error.
Precision: True positives / (True positives + False positives)
Recall: True positives / (True positives + False negatives)
F1-Score: Harmonic mean of precision and recall
• Quality control requires balancing precision and recall
• Context determines optimal metric weights
• Real-time performance is critical
• Define acceptable false positive/negative rates
• Use F1-score for overall performance measure
• Consider the cost of different types of errors
• Not considering the cost of errors
• Ignoring the precision-recall trade-off
FAQ
Q: How accurate are AI systems compared to human inspectors in quality control?
A: AI systems typically achieve higher accuracy than human inspectors:
Consistency: AI maintains 99%+ consistency vs. 70-85% for humans
Speed: AI inspects 1000s of items per minute vs. 10s per minute for humans
Defect Detection: AI can detect microscopic defects invisible to humans
24/7 Operation: AI doesn't suffer from fatigue or attention loss
Standardization: AI applies identical criteria across all inspections
Learning: AI improves accuracy over time with more data
Modern AI quality control systems typically achieve 95-99% accuracy with very low false positive rates.
Q: What are the main challenges in implementing AI quality control systems?
A: Main implementation challenges include:
Data Quality: Need for large, high-quality, labeled datasets
Initial Investment: High upfront costs for hardware and software
Integration: Connecting with existing manufacturing systems
Staff Training: Teaching operators to work with AI systems
Change Management: Organizational adaptation to new processes
Model Validation: Ensuring AI performs reliably in production
Regulatory Compliance: Meeting industry standards and certifications
Success requires careful planning, pilot programs, and change management.