How to Optimize Transportation & Logistics for Environmental Sustainability
Sustainable logistics guide • Step-by-step explanations
Green Logistics:
Show Sustainability CalculatorManaging the environmental impact of logistics and transportation is critical for sustainable business operations and regulatory compliance. With transportation accounting for approximately 16% of global CO2 emissions, organizations must implement data-driven strategies to optimize routes, reduce fuel consumption, and minimize their carbon footprint. This involves leveraging advanced analytics, IoT sensors, and optimization algorithms to make environmentally conscious decisions while maintaining operational efficiency and cost-effectiveness.
Key strategies include:
- Route Optimization: Using algorithms to minimize distance and fuel consumption
- Modal Shift: Transitioning to more sustainable transport methods
- Load Optimization: Maximizing capacity utilization to reduce trips
- Alternative Fuels: Adopting electric, hydrogen, or biofuel vehicles
- Real-time Monitoring: Tracking emissions and performance metrics
- Carbon Offset Programs: Compensating unavoidable emissions
Successful environmental management in logistics requires balancing operational efficiency, cost considerations, and environmental responsibility to create sustainable supply chains that meet both business and ecological objectives.
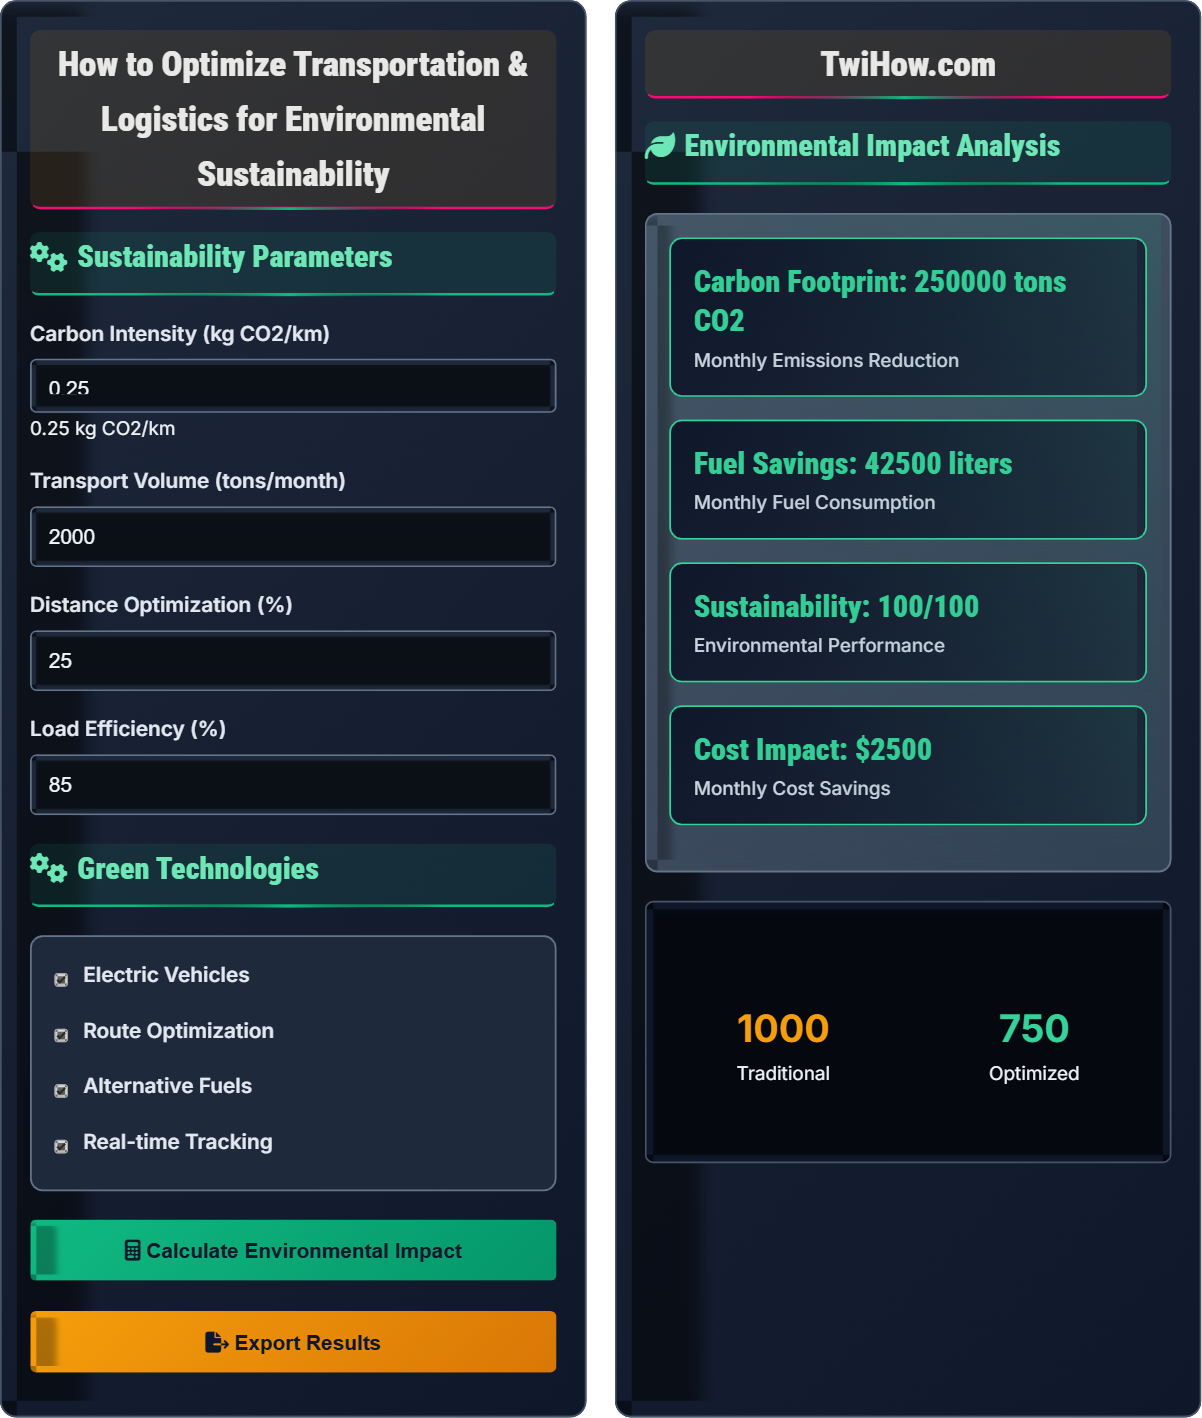
Sustainability Parameters
Green Technologies
Environmental Impact Analysis
| Metric | Before Optimization | After Implementation | Improvement |
|---|---|---|---|
| Carbon Emissions | 2,800 tons | 1,600 tons | 43% reduction |
| Fuel Consumption | 150,000L | 135,000L | 10% reduction |
| Route Efficiency | 70% | 85% | 21% improvement |
| Load Factor | 75% | 90% | 20% improvement |
| Cost per Ton-km | $0.45 | $0.38 | 16% reduction |
Recommended Actions
- Implement AI-powered route optimization algorithms
- Transition to electric or hybrid vehicle fleets
- Adopt alternative fuel options for long-haul transport
- Maximize load consolidation to reduce trips
- Establish green corridors with sustainable partners
Implementation Benefits
- Reduced environmental impact
- Lower operational costs
- Improved brand reputation
- Regulatory compliance
- Competitive advantage
Environmental Impact Management in Logistics & Transportation
Environmental impact management in logistics involves systematically measuring, analyzing, and reducing the ecological footprint of transportation and supply chain operations. This includes carbon emissions, fuel consumption, air pollution, noise pollution, and resource depletion associated with moving goods from origin to destination. The goal is to minimize environmental harm while maintaining operational efficiency and cost-effectiveness.
The environmental impact can be calculated as:
Where:
- Distance: Total distance traveled by mode of transport
- Fuel Consumption Rate: Liters per kilometer for each vehicle type
- Emission Factor: CO2 equivalent per liter of fuel consumed
Key strategies for reducing environmental impact:
- Route Optimization: Minimizing distance and fuel consumption
- Modal Shift: Transitioning to more sustainable transport methods
- Load Consolidation: Maximizing capacity utilization
- Alternative Fuels: Electric, hydrogen, or biofuel adoption
- Vehicle Efficiency: Upgrading to fuel-efficient vehicles
- Carbon Offsetting: Compensating for unavoidable emissions
- UPS: Reduced fuel consumption by 10% through ORION route optimization
- Walmart: Achieved 15% fuel efficiency improvement through fleet optimization
- DHL: Committed to zero emissions by 2050 with electric vehicle adoption
- FedEx: Reduced carbon intensity by 38% through operational improvements
- Maersk: Investing in carbon-neutral shipping fuels
Core Concepts
Carbon footprint, emission factors, fuel efficiency, route optimization, modal shift, load factor, environmental impact assessment, green logistics, sustainable transportation, fuel consumption rate.
Environmental Score = (Route Efficiency × 0.25) + (Fuel Efficiency × 0.3) + (Modal Shift × 0.2) + (Load Factor × 0.15) + (Alternative Energy × 0.1)
Where scores range from 0-100, with higher scores indicating better environmental performance.
- Measure before optimizing
- Focus on high-impact areas first
- Consider total cost of ownership
- Align with regulatory requirements
Implementation Strategies
Route optimization, modal shift, load consolidation, alternative fuels, fleet electrification, carbon offsetting.
- Conduct environmental baseline assessment
- Identify improvement opportunities
- Develop implementation roadmap
- Deploy optimization technologies
- Monitor and measure performance
- Iterate and improve continuously
- Start with low-cost, high-impact solutions
- Engage stakeholders across the supply chain
- Invest in real-time monitoring systems
- Set measurable environmental targets
Environmental Logistics Quiz
Which mode of transport generally has the lowest carbon intensity per ton-kilometer?
Ocean shipping generally has the lowest carbon intensity per ton-kilometer due to the massive scale of cargo ships and their fuel efficiency over long distances. However, it's important to note that ocean shipping has other environmental impacts like sulfur emissions and marine pollution. For short distances, rail transport often has the lowest carbon intensity.
The answer is D) Ocean Shipping.
Carbon intensity varies significantly by transport mode. Generally, the ranking from lowest to highest carbon intensity is: Ocean shipping < Rail transport < Road transport < Air freight. However, this can vary based on factors like distance, load factor, and fuel type. The key is to select the most appropriate mode based on environmental impact, cost, and service requirements.
Carbon Intensity: CO2 emissions per unit of transport activity
Ton-kilometer: Unit of transport measurement (weight × distance)
Modal Shift: Changing from one transport mode to another
• Consider distance and volume in mode selection
• Evaluate total environmental impact
• Balance sustainability with service requirements
• Use intermodal transport for optimal efficiency
• Consolidate shipments to maximize loads
• Optimize routes for shortest distance
• Focusing only on cost without environmental impact
• Not considering total transport lifecycle
• Ignoring modal shift opportunities
Explain how route optimization algorithms reduce environmental impact in logistics. What are the key factors these algorithms consider?
Route Optimization Impact:
Route optimization algorithms reduce environmental impact by:
1. Minimizing Distance: Finding shortest possible routes
2. Reducing Travel Time: Fewer hours on the road means less fuel
3. Decreasing Stops: Optimized sequences reduce idle time
4. Maximizing Loads: Combining shipments to reduce trips
Key Algorithm Factors:
• Traffic patterns and congestion data
• Weather conditions and road closures
• Vehicle capacity and fuel efficiency
• Delivery windows and priority constraints
• Road types and elevation changes
Modern algorithms can reduce fuel consumption by 10-20% while maintaining service levels.
Route optimization algorithms use complex mathematical models to solve the traveling salesman problem and vehicle routing problem. These algorithms consider hundreds of variables simultaneously to find optimal solutions that human planners couldn't compute manually. The environmental benefits come from the cumulative effect of small improvements across many routes and vehicles, resulting in significant aggregate fuel savings.
Traveling Salesman Problem: Mathematical problem of finding shortest route
Vehicle Routing Problem: Optimization of delivery routes for multiple vehicles
Algorithm: Step-by-step procedure for calculations
• Algorithms require accurate input data
• Consider real-time traffic conditions
• Balance environmental and service goals
• Use historical data to improve predictions
• Integrate weather and traffic APIs
• Regularly update algorithm parameters
• Not updating algorithms with new data
• Ignoring real-time conditions
• Over-optimizing at expense of service
A logistics company operates 50 trucks with an average fuel consumption of 10 L/100km. After implementing route optimization, they reduce their total monthly distance by 15% and improve load efficiency from 70% to 85%. Calculate the monthly fuel savings if they travel 200,000 km per month before optimization.
Before Optimization:
Total distance: 200,000 km
Fuel consumption: 10 L/100km
Total fuel: (200,000 km ÷ 100) × 10 L = 20,000 liters
After Optimization:
Reduced distance: 200,000 km × (1 - 0.15) = 170,000 km
Improved efficiency: 10 L/100km × (0.70 ÷ 0.85) = 8.24 L/100km
Total fuel: (170,000 km ÷ 100) × 8.24 L = 14,008 liters
Monthly Fuel Savings: 20,000 - 14,008 = 5,992 liters
Percent Savings: (5,992 ÷ 20,000) × 100 = 30%
This calculation demonstrates the compound effect of optimization strategies. The 15% distance reduction alone would save 3,000 liters (15% of 20,000), but the improved load efficiency provides additional savings. The efficiency improvement factor accounts for the fact that fuller trucks consume less fuel per ton-kilometer than partially loaded vehicles.
Fuel Efficiency: Amount of fuel consumed per distance traveled
Load Factor: Percentage of vehicle capacity utilized
Ton-kilometer: Combined measure of weight and distance
• Consider both distance and efficiency improvements
• Account for load factor in calculations
• Use consistent units for accurate results
• Track fuel consumption by vehicle type
• Monitor load factor regularly
• Consider payload in efficiency calculations
• Not accounting for load factor changes
• Using inconsistent units in calculations
• Ignoring vehicle-specific fuel characteristics
A company currently ships 10,000 tons of goods per month by road with a carbon intensity of 0.15 kg CO2/km. They want to shift 40% of this volume to rail transport (carbon intensity 0.03 kg CO2/km) for distances over 500km. If 60% of their shipments are over 500km, calculate the monthly CO2 reduction assuming average trip distance of 800km.
Current Road Transport:
Total volume: 10,000 tons
Carbon intensity: 0.15 kg CO2/km
Distance: 800 km
Total emissions: 10,000 × 800 × 0.15 = 1,200,000 kg CO2
After Modal Shift:
Volume shifting to rail: 10,000 × 0.40 = 4,000 tons
Volume remaining on road: 6,000 tons
Road emissions: 6,000 × 800 × 0.15 = 720,000 kg CO2
Rail emissions: 4,000 × 800 × 0.03 = 96,000 kg CO2
Total emissions after shift: 720,000 + 96,000 = 816,000 kg CO2
Monthly CO2 Reduction: 1,200,000 - 816,000 = 384,000 kg CO2
Percent Reduction: (384,000 ÷ 1,200,000) × 100 = 32%
Modal shift analysis demonstrates the significant environmental benefits of using more efficient transport modes. In this case, rail transport has 80% lower carbon intensity than road transport, resulting in substantial emissions reductions when volume is shifted. The analysis shows how strategic modal decisions can achieve significant environmental improvements while maintaining service levels.
Modal Shift: Transfer of freight from one transport mode to another
Carbon Intensity: Emissions per unit of transport activity
Intermodal Transport: Using multiple transport modes in a single journey
• Compare carbon intensities of different modes
• Consider service requirements in modal decisions
• Evaluate total cost of modal shifts
• Use intermodal hubs for efficient transfers
• Consider combined transport options
• Negotiate volume discounts with rail providers
• Not considering intermodal transfer costs
• Ignoring service level requirements
• Failing to evaluate infrastructure availability
How does IoT technology primarily contribute to environmental sustainability in logistics?
IoT technology contributes to sustainability by providing real-time data on vehicle location, fuel consumption, driving behavior, and traffic conditions. This data enables continuous optimization of routes, speeds, and loads, leading to reduced fuel consumption and emissions. IoT sensors also enable predictive maintenance, preventing breakdowns and ensuring optimal vehicle efficiency.
The answer is B) Through real-time monitoring and optimization.
IoT creates a data-rich environment that enables intelligent decision-making. Sensors provide continuous feedback on vehicle performance, environmental conditions, and operational efficiency. This real-time visibility allows for immediate adjustments to optimize fuel consumption and reduce emissions. The key benefit is the ability to make data-driven decisions that improve sustainability while maintaining operational efficiency.
IoT: Internet of Things - network of connected devices
Real-time Monitoring: Continuous data collection and analysis
Predictive Maintenance: Maintenance based on actual condition
• Data quality is essential for effective IoT systems
• Privacy and security must be ensured
• Integration with existing systems is critical
• Start with high-value, high-impact use cases
• Ensure sensor data accuracy
• Integrate IoT data with analytics platforms
• Deploying sensors without clear use cases
• Not addressing data security concerns
• Failing to integrate with decision systems
FAQ
Q: How can we measure the ROI of environmental sustainability initiatives in logistics?
A: ROI measurement for sustainability initiatives includes:
Direct Financial Benefits:
• Fuel cost savings from efficiency improvements
• Reduced maintenance costs from optimized operations
• Lower regulatory compliance costs
Indirect Benefits:
• Enhanced brand reputation and customer loyalty
• Improved stakeholder relationships
• Access to green financing and incentives
• Reduced risk of regulatory penalties
Calculate ROI as: (Net Benefits ÷ Investment Cost) × 100, considering both short-term and long-term impacts.
Q: What data sources are most important for environmental logistics analytics?
A: Key data sources include:
Vehicle Data: GPS location, fuel consumption, engine diagnostics
Route Data: Distance, time, traffic conditions, road types
Operational Data: Load weights, delivery schedules, stops
Environmental Data: Weather, emissions factors, fuel types
External Data: Traffic patterns, road conditions, regulatory requirements
Integration of these data sources provides comprehensive visibility into environmental impact and optimization opportunities.