Reverse Logistics and Product Returns Management
Complete guide • Step-by-step explanations
Reverse Logistics Fundamentals:
Show Returns CalculatorReverse logistics encompasses all processes involved in moving products from their final destination back to the seller or manufacturer for the purpose of capturing value or proper disposal. This includes returns management, recycling, remanufacturing, and waste disposal. In manufacturing and supply chain contexts, effective reverse logistics can significantly impact profitability, customer satisfaction, and environmental compliance.
Key considerations include cost management, customer experience, inventory control, and regulatory compliance. The process involves multiple stakeholders and requires sophisticated tracking systems, clear policies, and efficient handling procedures. Modern reverse logistics strategies focus on sustainability, circular economy principles, and value recovery.
Core principles:
- Cost Minimization: Efficient handling and processing of returns
- Customer Satisfaction: Streamlined return processes
- Value Recovery: Maximizing salvage value from returned items
- Compliance: Adherence to environmental and safety regulations
Successful reverse logistics programs require integrated systems, clear policies, and collaboration between all supply chain partners. The goal is to turn returns from a cost center into a profit center while maintaining customer satisfaction.
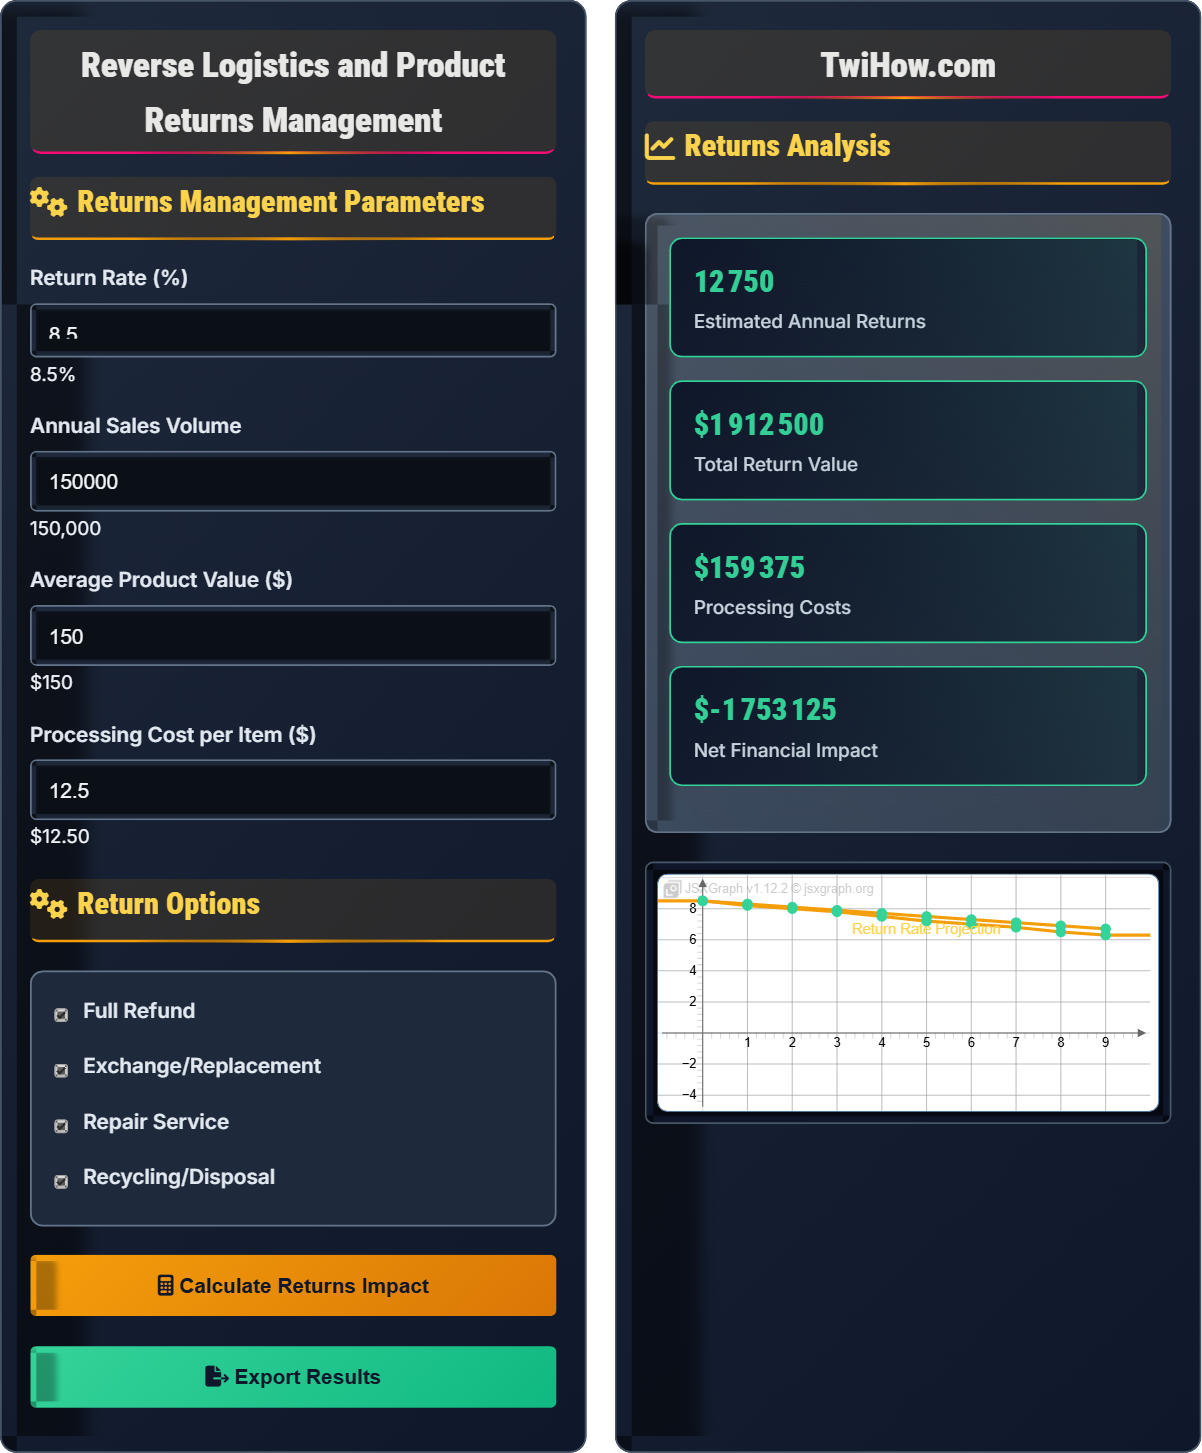
Returns Management Parameters
Return Options
Returns Analysis
| Category | Quantity | Percentage | Value ($) |
|---|---|---|---|
| Refunds | 8,500 | 66.7% | $1,275,000 |
| Exchanges | 2,550 | 20.0% | $382,500 |
| Repairs | 1,275 | 10.0% | $191,250 |
| Recycles | 425 | 3.3% | $163,750 |
Return Process Steps
- Customer initiates return request
- Return authorization generated
- Shipping instructions provided
- Product received at facility
- Inspection and categorization
- Processing decision made
- Final disposition executed
Reverse Logistics and Returns Management Explained
Reverse logistics encompasses all processes involved in moving products from their final destination back to the seller or manufacturer for the purpose of capturing value or proper disposal. This includes returns management, recycling, remanufacturing, and waste disposal. In manufacturing and supply chain contexts, effective reverse logistics can significantly impact profitability, customer satisfaction, and environmental compliance.
The reverse logistics process follows this framework:
Where:
- Value Recovered: Revenue from resales, repairs, or materials
- Total Return Cost: Processing, transportation, and handling costs
- Processing Speed: Time to complete the return cycle
Common return categories and reasons:
- Customer Returns: Wrong size, wrong product, change of mind
- Defective Products: Manufacturing defects, quality issues
- End-of-Life: Product retirement, upgrades, obsolescence
- Warranty Claims: Product failures within warranty period
- Recalls: Safety issues, regulatory requirements
- Overstock: Excess inventory, seasonal adjustments
- Resale: Direct resale of returned items in good condition
- Refurbishment: Repair and resale at discounted prices
- Parts Harvesting: Extract valuable components
- Material Recovery: Recycle raw materials
- Trade-In Programs: Credit toward new purchases
- Donation: Charitable giving for tax benefits
Key Considerations
Reverse logistics, returns management, value recovery, circular economy, warranty processing, customer service.
Net Return Cost = (Processing Cost + Transportation) - (Value Recovery + Tax Benefits)
Where value recovery includes resale, refurbishment, and material recovery.
- Minimize processing time
- Maximize value recovery
- Maintain customer satisfaction
Implementation
Clear policies, efficient processes, technology integration, staff training, performance monitoring.
- Policy and procedure development
- System and facility setup
- Staff training and preparation
- Process execution and monitoring
- Customer experience impact
- Regulatory compliance
- Environmental responsibility
- Cost optimization
Reverse Logistics Learning Quiz
Which of the following is NOT typically considered a category of product returns in reverse logistics?
New product launches are forward logistics activities that move products from manufacturer to customer, not reverse logistics activities. All other options are common categories of product returns: customer dissatisfaction returns (wrong size, wrong product), warranty claim returns (product defects), and end-of-life returns (product retirement or upgrade). Reverse logistics specifically deals with products moving back through the supply chain.
The answer is D) New product launches.
Understanding the distinction between forward and reverse logistics is fundamental to managing supply chains effectively. Forward logistics moves products from manufacturer to customer, while reverse logistics moves products from customer back to manufacturer or disposal. This distinction is important because the processes, costs, and objectives differ significantly between the two directions.
Reverse Logistics: Movement of products from customer back to manufacturer
Forward Logistics: Movement of products from manufacturer to customer
Value Recovery: Capturing residual value from returned products
• Distinguish between forward and reverse flows
• Classify returns by category
• Optimize for value recovery
• Track return categories separately
• Implement preventive measures
• Focus on customer experience
• Confusing forward and reverse logistics
• Not categorizing returns properly
• Ignoring customer satisfaction impact
Explain the key cost components in reverse logistics and describe strategies for minimizing the financial impact of product returns while maintaining customer satisfaction.
Key Cost Components:
1. Transportation Costs: Shipping fees for returning products
2. Processing Costs: Inspection, handling, and administrative expenses
3. Storage Costs: Warehousing returned inventory
4. Labor Costs: Personnel for processing returns
5. Value Loss: Depreciation of returned products
Cost Minimization Strategies:
• Prevention: Improve product quality and customer education
• Streamlined Processes: Automate return authorization and tracking
• Value Recovery: Maximize resale, refurbishment, and material recovery
• Efficient Routing: Consolidate returns to reduce transportation costs
• Quick Processing: Reduce storage time and associated costs
Customer satisfaction is maintained by offering convenient return processes while focusing on prevention and efficient handling.
Reverse logistics costs can be substantial, often representing 3-5% of total sales for retailers. The key to effective management is balancing cost minimization with customer satisfaction. This requires understanding all cost components and implementing strategies that reduce expenses without compromising the customer experience. The most effective approach combines prevention with efficient processing.
Value Recovery: Capturing residual value from returned products
Cost Optimization: Reducing expenses while maintaining service levels
Customer Experience: Customer satisfaction with return process
• Track all cost components
• Balance cost and service
• Focus on prevention
• Use predictive analytics
• Implement automated systems
• Monitor key metrics
• Ignoring indirect costs
• Sacrificing customer experience
• Not measuring performance
A manufacturer sells 200,000 units annually with an average selling price of $200 per unit. The return rate is 12%, with 60% of returns being refunded, 30% exchanged, and 10% repaired. The average processing cost per return is $15. Calculate the total financial impact of returns and determine what percentage of annual revenue is lost to returns processing.
Calculations:
Total returns: 200,000 × 12% = 24,000 units
Refunds: 24,000 × 60% = 14,400 units × $200 = $2,880,000
Exchanges: 24,000 × 30% = 7,200 units (resale value $1,440,000)
Repairs: 24,000 × 10% = 2,400 units (resale value $480,000)
Processing costs: 24,000 × $15 = $360,000
Annual revenue: 200,000 × $200 = $40,000,000
Net financial impact: $2,880,000 (refunds) + $360,000 (processing) = $3,240,000
Percentage of revenue lost: ($3,240,000 ÷ $40,000,000) × 100 = 8.1%
Approximately 8.1% of annual revenue is impacted by returns processing.
This problem demonstrates the significant financial impact of returns on a company's bottom line. Even with a relatively modest 12% return rate, the financial impact represents 8.1% of annual revenue. This highlights the importance of managing returns effectively to minimize costs while maintaining customer satisfaction. The calculation shows both direct costs (processing) and opportunity costs (refunded revenue).
Return Rate: Percentage of sales that are returned
Financial Impact: Total cost of managing returnsOpportunity Cost: Revenue lost due to refunds
• Calculate all cost components
• Express impact as percentage of revenue
• Consider both direct and indirect costs
• Use consistent time periods
• Track return rates by product line
• Monitor trends over time
• Missing processing costs
• Not considering opportunity costs
• Inconsistent calculation methods
A company receives 10,000 returned electronics products annually. Of these, 40% are in good condition and can be resold at 90% of original price, 30% require minor repairs costing $25 each and can then be sold at 70% of original price, 20% are damaged beyond repair but have $30 worth of recyclable materials, and 10% are completely worthless. If the original price is $200, calculate the total value recovered and the percentage of original value retained.
Calculations:
Good condition: 10,000 × 40% = 4,000 units × $200 × 90% = $720,000
Repaired: 10,000 × 30% = 3,000 units × $200 × 70% = $420,000
Less repair costs: 3,000 × $25 = $75,000
Net from repairs: $420,000 - $75,000 = $345,000
Materials: 10,000 × 20% = 2,000 units × $30 = $60,000
Worthless: 10,000 × 10% = 1,000 units × $0 = $0
Total value recovered: $720,000 + $345,000 + $60,000 = $1,125,000
Original value: 10,000 × $200 = $2,000,000
Percentage retained: ($1,125,000 ÷ $2,000,000) × 100 = 56.25%
The company retains 56.25% of the original value through effective value recovery.
This problem demonstrates the importance of value recovery strategies in reverse logistics. By implementing different recovery methods for different return categories, the company retains over half of the original value. This shows how strategic thinking about returns can transform them from pure costs into revenue-generating opportunities. The key is matching the recovery method to the condition of the returned product.
Value Recovery: Capturing residual value from returned products
Resale: Selling returned products as-is
Refurbishment: Repairing and reselling products
• Match recovery method to product condition
• Account for processing costs
• Maximize recovery percentage
• Categorize returns by condition
• Calculate recovery costs
• Monitor recovery rates
• Not accounting for processing costs
• Using single recovery method
• Not tracking recovery rates
Which technology solution is most effective for tracking and managing the reverse logistics process?
RFID tags and automated sorting systems are most effective for reverse logistics management. RFID technology provides real-time tracking of returned items throughout the process, while automated sorting systems can quickly categorize items based on their condition and required action. This combination provides visibility, accuracy, and efficiency that manual systems cannot match.
While spreadsheets and paper documentation may be used for record keeping, they lack the real-time tracking and automation capabilities needed for efficient reverse logistics operations.
The answer is B) RFID tags and automated sorting.
Technology plays a crucial role in modern reverse logistics operations. RFID tags provide unique identification and tracking capabilities, while automated sorting systems increase efficiency and accuracy. The combination of these technologies enables real-time visibility into the return process, which is essential for managing costs and optimizing value recovery. Manual systems are too slow and error-prone for high-volume operations.
RFID: Radio Frequency Identification for item tracking
Automation: Using technology to reduce manual effort
Visibility: Real-time tracking of items in process
• Implement real-time tracking
• Automate where possible
• Maintain process visibility
• Use barcode scanning
• Implement WMS systems
• Integrate with ERP systems
• Relying on manual processes
• Not integrating systems
• Lacking real-time visibility
FAQ
Q: How can we reduce the return rate while maintaining customer satisfaction?
A: Reducing return rates while maintaining satisfaction requires a multi-faceted approach:
1. Improve Product Descriptions: Detailed specifications, high-quality images, and clear usage instructions
2. Enhance Quality Control: Rigorous testing before shipping
3. Customer Education: How-to videos, installation guides, and troubleshooting resources
4. Pre-Shipping Checks: Verify correct items and quantities
5. Easy Returns: Streamlined process reduces frustration and builds trust
Focus on prevention while maintaining a customer-friendly return policy to preserve satisfaction.
Q: What's the typical cost of processing a product return?
A: Return processing costs vary significantly by industry and product type:
Apparel Retail: $10-25 per return (including transportation)
Electronics: $15-35 per return (due to inspection requirements)
Large Appliances: $50-100 per return (involves pickup and handling)
Software/Digital: Minimal processing costs
Industry averages range from $12-20 per return, with 30-40% attributed to transportation and 60-70% to processing, inspection, and restocking. Costs can be reduced through automation and efficient processes.