How to Debug Errors?
Complete debugging guide • Step-by-step explanations
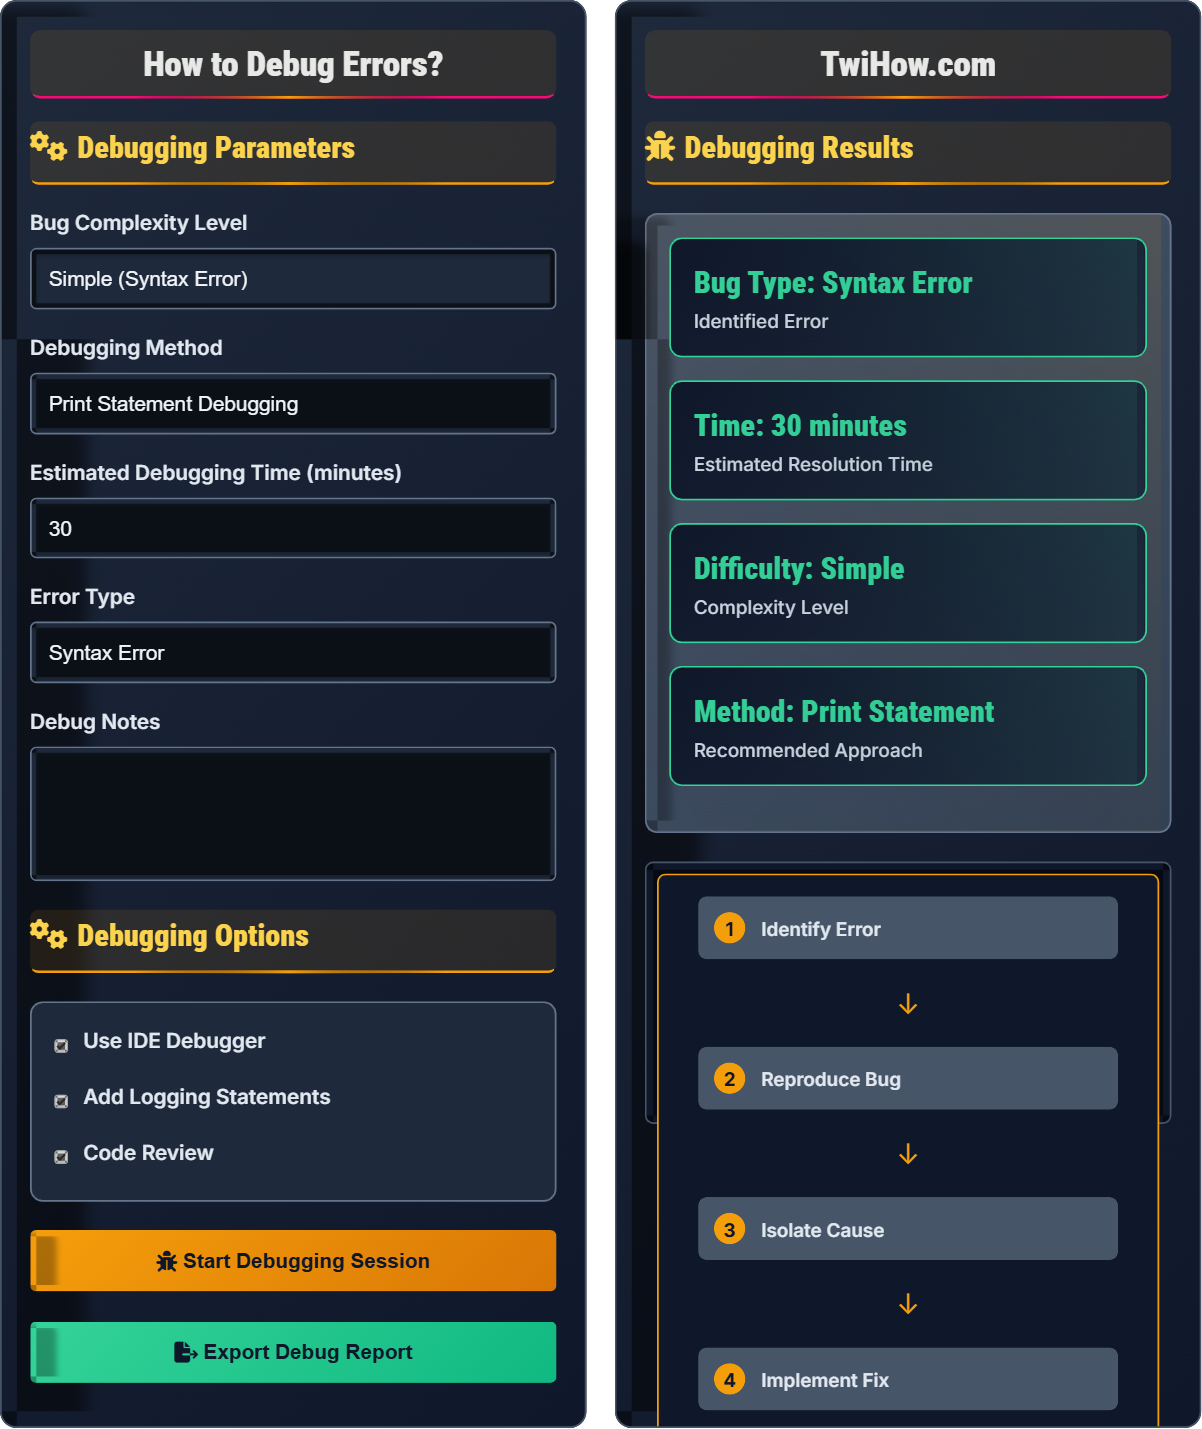
Debugging Fundamentals:
Show Debugging SimulatorDebugging is the process of identifying, analyzing, and resolving bugs or defects in computer programs. It's a systematic approach to finding and fixing errors that cause software to behave unexpectedly or produce incorrect results.
Effective debugging follows a methodical approach:
- Reproduce: Consistently recreate the error
- Isolate: Narrow down the source of the problem
- Identify: Understand the root cause
- Fix: Implement the solution
- Verify: Confirm the fix works and doesn't break anything else
Modern debugging tools include integrated development environment (IDE) debuggers, logging frameworks, and profiling tools that help developers understand program flow and state during execution.
Debugging Parameters
Debugging Options
Debugging Results
Sample Error Simulation
Error Message: TypeError: Cannot read property 'length' of undefined
function processData(data) {
return data.items.length; // data.items might be undefined
}
// Fixed code:
function processData(data) {
return data && data.items ? data.items.length : 0;
}
How Debugging Works Explained
Debugging is the systematic process of finding, analyzing, and fixing bugs or defects in computer programs. It involves identifying unexpected behavior, tracing the root cause, and implementing solutions to correct the problem. Debugging is essential for maintaining software quality and ensuring programs function as intended.
The systematic debugging process consists of five main steps:
Where:
- Reproduce: Consistently recreate the error condition
- Isolate: Narrow down the source of the problem
- Identify: Understand the root cause of the bug
- Fix: Implement the solution to resolve the issue
- Verify: Confirm the fix works and doesn't introduce new issues
Common debugging approaches:
- Print Statement Debugging: Adding console.log or print statements to trace execution
- Interactive Debugging: Using IDE debuggers with breakpoints and step-through
- Binary Search: Systematically eliminating code sections to isolate bugs
- Duck Debugging: Explaining the problem aloud to gain insight
- Code Review: Having another person examine the code
- Unit Testing: Writing tests to verify individual components
- Reproduce First: Always reproduce the bug before attempting to fix it
- Make One Change: Only modify one thing at a time to isolate the fix
- Document Changes: Keep track of what you've tried and what worked
- Test Thoroughly: Verify the fix works and doesn't break other functionality
- Write Tests: Create regression tests to prevent the bug from recurring
- Learn from Bugs: Understand why the bug occurred to avoid similar issues
Debugging Fundamentals
Bug, error, exception, stack trace, breakpoint, debugger, log, reproduction, isolation.
Problem = Root Cause + Manifestation
Debugging = Observation + Analysis + Solution + Verification
- Always reproduce the bug first
- Make one change at a time
- Understand the root cause, not just symptoms
Tools & Techniques
IDE debuggers, console logs, profilers, linters, testing frameworks, version control.
- Systematic elimination
- Pattern recognition
- Hypothesis testing
- Root cause analysis
- Performance impact of debugging
- Security implications
- Production vs development environments
- Team collaboration
Debugging Learning Quiz
Which of the following is the most effective initial approach when encountering a runtime error?
Reading the error message and stack trace is the most effective initial approach because it provides crucial information about what went wrong and where. The error message often contains details about the type of error, while the stack trace shows the sequence of function calls leading to the error. This information helps pinpoint the exact location and nature of the problem.
The answer is B) Read the error message and stack trace carefully.
Effective debugging starts with gathering information. Error messages and stack traces are the program's way of communicating what went wrong. They contain valuable clues such as line numbers, function names, and the type of error. Jumping to conclusions or making random changes without understanding the problem often makes things worse. The stack trace is particularly important as it shows the call history, helping you trace back from where the error occurred to where the problematic data originated.
Error Message: Text describing the problem that occurred
Stack Trace: List of function calls leading to the error
Runtime Error: Error that occurs while the program is running
• Always read the full error message
• Examine the stack trace from bottom to top
• Look for the first line in your own code
• Copy the error message and search online for solutions
• Use your IDE's error highlighting features
• Learn to interpret common error patterns
• Not reading error messages thoroughly
• Looking at the wrong part of the stack trace
• Making multiple changes simultaneously
Explain the systematic approach to debugging a logic error that causes incorrect calculations. Include the steps you would take and the tools you would use.
Systematic Debugging Strategy:
1. Reproduce the Error: Create a test case that consistently demonstrates the incorrect calculation.
2. Isolate the Problem: Determine which specific calculation or function is producing the wrong result.
3. Examine Input/Output: Log or inspect the values going into and coming out of the calculation.
4. Step Through Execution: Use a debugger to execute the code line by line and observe variable states.
5. Verify Logic: Compare the expected algorithm with the actual implementation.
6. Test Fix: Implement the correction and verify it solves the problem without introducing new issues.
Logic errors are particularly challenging because the program runs without crashing but produces incorrect results. The key is to trace the data flow through the calculation and compare it with the expected behavior. Unlike syntax or runtime errors, logic errors don't have obvious error messages, so systematic verification of intermediate values is crucial. Debugging tools like variable watches and conditional breakpoints are invaluable for examining specific conditions during execution.
Logic Error: Code that runs but produces incorrect results
Debugger: Tool for stepping through code execution
Variable Watch: Feature to monitor variable values during debugging
• Always verify intermediate values
• Test with known inputs and expected outputs
• Check boundary conditions
• Write unit tests for calculations
• Use logging to trace execution paths
• Verify mathematical formulas independently
• Assuming the algorithm is correct
• Not testing edge cases
• Changing multiple parts simultaneously
A web application has been experiencing intermittent crashes in production. The error logs show a "Memory Leak" message but only under heavy load conditions. Describe your debugging strategy for this complex issue, including the tools you would use and the steps you would take.
Memory Leak Debugging Strategy:
1. Environment Setup: Replicate production environment with similar load conditions using stress testing tools.
2. Profiling Tools: Use memory profilers to monitor heap usage and identify growing memory consumption.
3. Code Analysis: Examine code for common memory leak patterns: unclosed resources, event listeners, intervals, circular references.
4. Monitoring: Implement memory usage monitoring and logging to track patterns over time.
5. Hypothesis Testing: Make targeted fixes and verify the memory usage stabilizes.
6. Long-term Verification: Run extended tests to ensure the fix is permanent.
Memory leaks are among the most challenging bugs to debug because they manifest gradually under specific conditions. They often go unnoticed in development but become apparent under production load. Memory profilers are essential tools for identifying these issues, showing memory allocation patterns and helping locate objects that aren't being properly garbage collected. The key is creating a reproducible test scenario that mimics the production load conditions where the leak occurs.
Memory Leak: Program holds onto memory that is no longer needed
Heap: Memory area for dynamic allocation
Garbage Collection: Automatic memory management process
• Reproduce the exact conditions where the leak occurs
• Monitor memory usage over time
• Test fixes under similar load conditions
• Use load testing tools like Apache Bench
• Monitor both short-term and long-term memory usage
• Look for patterns in resource usage
• Testing only under light load conditions
• Not monitoring memory over extended periods
• Fixing symptoms rather than root cause
You're working on a team project and encounter a bug introduced by a recent commit. The commit was made by a colleague who is currently unavailable. Explain your debugging approach in this situation, considering both technical and collaborative aspects.
Technical Approach: Use version control tools to identify the specific changes in the problematic commit. Create a local branch to experiment with fixes without affecting the main codebase. Use git blame to identify which lines were changed recently.
Collaborative Approach: Document the issue thoroughly and leave comments in the code. Create a detailed bug report with reproduction steps. When the colleague returns, discuss the issue together to understand their original intent and ensure the fix aligns with the overall design.
Process: Make the fix, test thoroughly, and submit a pull request with clear explanation of the problem and solution. Consider adding tests to prevent regression.
Debugging in team environments requires both technical skills and communication abilities. Version control systems are invaluable debugging tools, allowing you to trace when and how bugs were introduced. Understanding the context of changes is important - what was the original intent behind the code? Collaborative debugging emphasizes documentation, clear communication, and respect for team members. Good debugging practices in teams include comprehensive commit messages, thorough testing, and clear issue tracking.
Version Control: System for tracking code changes over time
Regression: New bug introduced by fixing another bug
Code Review: Systematic examination of source code
• Always communicate significant changes to teammates
• Preserve the original intent of the code
• Test changes in isolated environment first
• Use git bisect to find problematic commits
• Write clear commit messages for easier debugging
• Maintain good documentation for team collaboration
• Making assumptions about other people's code
• Not documenting changes made to others' code
• Rushing to fix without understanding context
Which debugging tool would be most appropriate for identifying performance bottlenecks in a web application?
A performance profiler is specifically designed to identify performance bottlenecks by measuring execution time, memory usage, and resource consumption of different parts of the application. It can show which functions take the most time to execute, where memory allocations occur, and identify inefficient operations. While other tools are valuable for different aspects of debugging, only a profiler addresses performance issues directly.
The answer is B) Performance profiler.
Effective debugging requires using the right tool for the specific type of problem. Different debugging challenges require different approaches and tools. Performance issues need profiling tools that can measure execution time and resource usage. Syntax errors need linters and compilers. Logic errors benefit from debuggers and logging. Understanding which tool is appropriate for each type of problem is a key debugging skill.
Performance Profiler: Tool that measures execution performance
Syntax Checker: Tool that validates code syntax
Linter: Tool that identifies style and potential issues
• Match the tool to the type of problem
• Use multiple tools for complex issues
• Understand the limitations of each tool
• Combine static analysis with runtime profiling
• Use browser dev tools for web applications
• Profile in production-like environments
• Using inappropriate tools for the problem
• Not profiling under realistic conditions
• Focusing on micro-optimizations
FAQ
Q: How do I know if I'm debugging efficiently or just wasting time?
A: Efficient debugging has several indicators:
1. Systematic Approach: You're following a methodical process rather than making random changes
2. Progress Tracking: You can articulate what you've learned with each test
3. Time Limits: You set reasonable time limits for each debugging attempt
4. Documentation: You're recording what you've tried and what didn't work
If you're spending more than 30-60 minutes on a single bug without making progress, consider taking a break, getting fresh perspective, or seeking help. Sometimes stepping away allows your subconscious mind to work on the problem.
Q: What's the difference between debugging and testing?
A: Testing and debugging are related but distinct activities:
Testing: The process of executing a program with the intent of finding errors. Testers create test cases and scenarios to validate that software behaves as expected.
Debugging: The process of finding, analyzing, and fixing specific bugs that have been identified during testing or reported by users.
Think of it as a pipeline: Testing finds the problems, debugging solves them. Testing is proactive (preventive), while debugging is reactive (corrective). Both are essential parts of the software development lifecycle.