How to Evaluate Walkability and Transit Access of a Potential Home
Real estate guide • Step-by-step explanations
Walkability & Transit Access:
Show Evaluation ToolEvaluating walkability and transit access is crucial for determining the livability and convenience of a potential home. Walkability measures how friendly an area is for walking, while transit access assesses the availability and quality of public transportation. These factors significantly impact daily life, transportation costs, and overall quality of life.
Key components of walkability and transit access evaluation include:
- Walkability Score: Measures access to nearby amenities on foot
- Transit Score: Evaluates public transportation options
- Proximity to Amenities: Distance to shops, restaurants, parks
- Transit Frequency: How often buses/trains arrive
- Safety Factors: Pedestrian infrastructure and crime rates
- Connectivity: Street grid patterns and sidewalk quality
Understanding these factors helps buyers make informed decisions about their housing location and potential transportation costs.
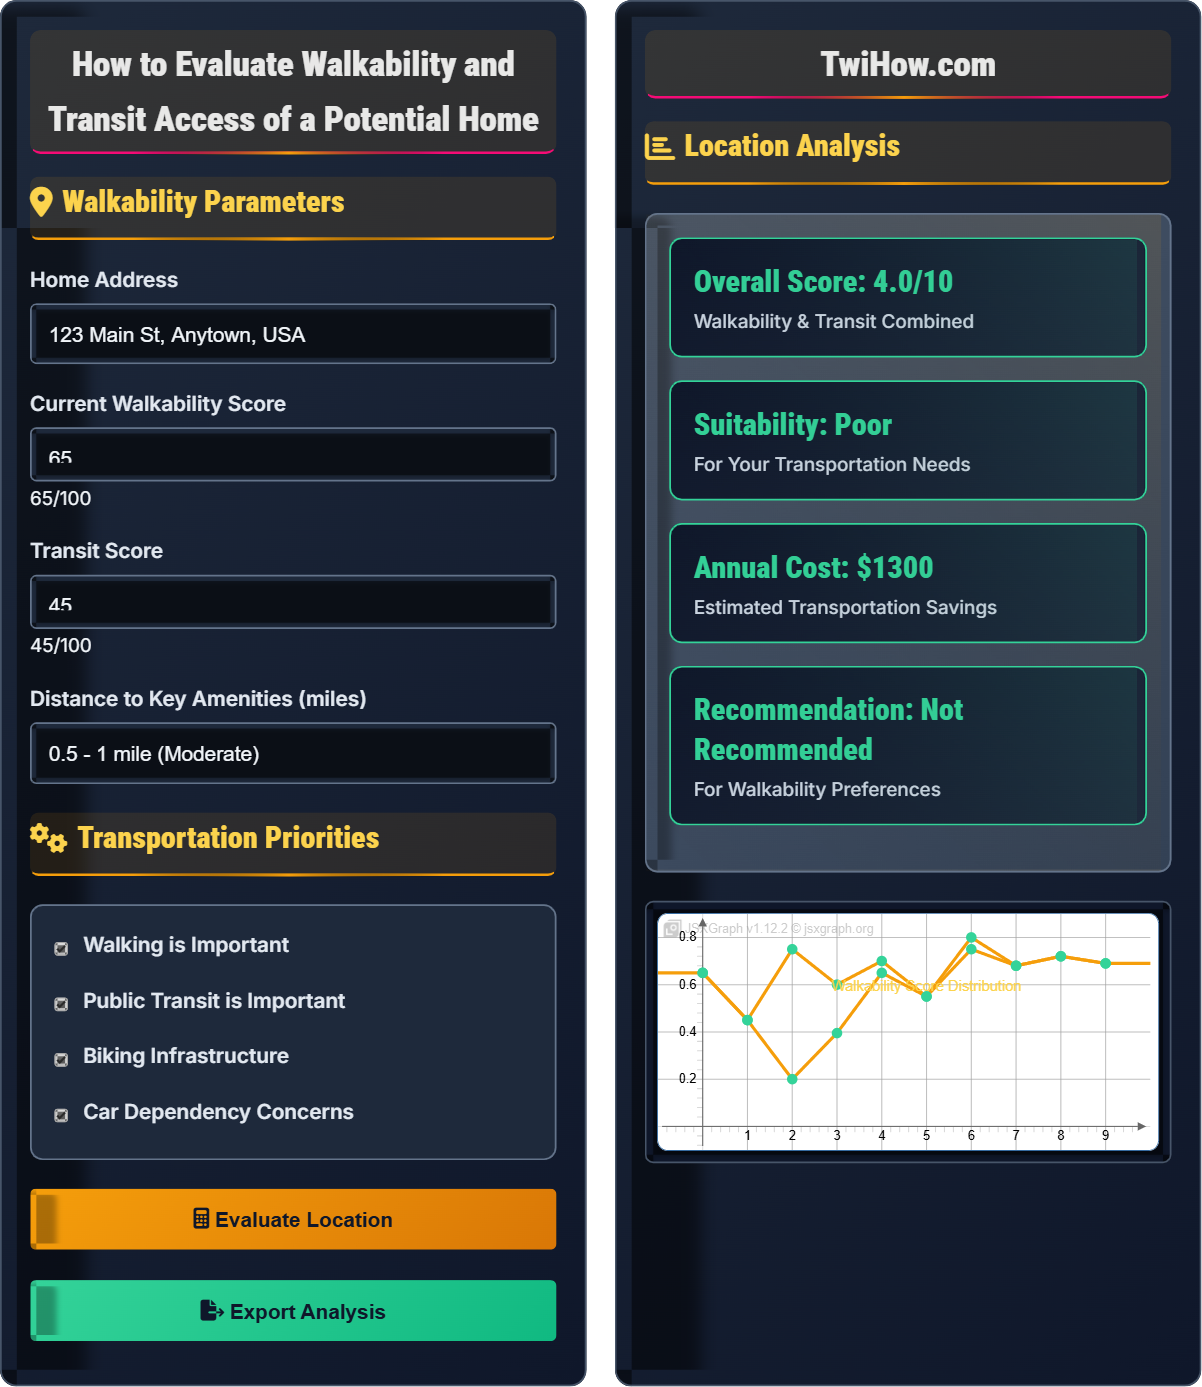
Walkability Parameters
Transportation Priorities
Location Analysis
| Factor | Score | Weight | Impact |
|---|---|---|---|
| Walkability | 65/100 | 40% | High |
| Transit Access | 45/100 | 30% | Medium |
| Amenity Proximity | 75/100 | 20% | High |
| Infrastructure | 60/100 | 10% | Medium |
Understanding Walkability and Transit Access
Walkability is a measure of how friendly an area is for walking. It takes into account factors such as the presence of sidewalks, crosswalks, traffic signals, and the proximity of amenities like shops, restaurants, and parks. Higher walkability scores indicate areas where residents can easily meet their daily needs without relying heavily on cars.
Transit access measures the quality and availability of public transportation in an area. Key factors include:
- Frequency: How often buses, trains, or other transit options arrive
- Connectivity: Number of routes and destinations accessible
- Reliability: Consistency of schedules and service
- Accessibility: ADA compliance and ease of use
- Cost: Affordability of transit options
- Integration: How well different transit modes connect
This weighted formula accounts for the relative importance of different factors. Walkability typically has the highest weight because it encompasses many aspects of neighborhood design that affect both walking and cycling. Transit access is also important for car-free travel options.
For example, if Walkability = 70, Transit = 50, Amenities = 80, and Infrastructure = 65, the Overall Score would be: (70×0.4) + (50×0.3) + (80×0.2) + (65×0.1) = 28 + 15 + 16 + 6.5 = 65.5/100.
Key factors to consider when evaluating walkability include:
- Street Connectivity: Grid patterns vs. cul-de-sacs and dead ends
- Sidewalk Quality: Width, condition, and accessibility
- Intersection Density: Number of intersections per square mile
- Land Use Mix: Diversity of nearby land uses
- Population Density: Concentration of residents and businesses
- Safety Features: Lighting, visibility, and traffic calming
Important indicators of good transit access include:
- Stop Density: Number of stops within walking distance
- Service Frequency: How often vehicles arrive during peak hours
- Route Coverage: Percentage of area served by transit
- Travel Time Reliability: Consistency of arrival times
- First/Last Mile: Ease of reaching transit stops
- Multi-modal Integration: Biking, walking, and driving connections
Walkability Fundamentals
Walkability score, transit score, amenity proximity, street connectivity, population density, land use mix.
Overall Score = Σ(Factor Score × Weight)
Where Factor Score ranges from 0-100 and weights sum to 100%. The formula accounts for multiple criteria that influence walkability.
- Higher walkability scores correlate with better health outcomes
- Walkable neighborhoods command premium property values
- Transit access reduces household transportation costs
- Connected street networks promote walkability
Evaluation Strategies
Online tools,实地考察, amenity mapping, transit route analysis, neighborhood walk tests, safety assessment.
- Use online walkability tools (Walk Score, Transit Score)
- Visit the neighborhood at different times of day
- Test walking routes to key destinations
- Check transit schedules and frequency
- Assess safety and infrastructure quality
- Walkability scores are estimates,实地验证 is important
- Seasonal variations affect walkability
- Personal mobility needs vary significantly
- Future development may change walkability
Walkability & Transit Quiz
According to Walk Score methodology, which range represents a "Walker's Paradise"?
According to Walk Score methodology, a "Walker's Paradise" designation is given to neighborhoods with scores of 90-100. These areas have almost all errands within walking distance. Scores of 70-89 are considered "Very Walkable," 50-69 are "Somewhat Walkable," 25-49 are "Car-Dependent," and 0-24 are "Car-Dependent with Some Amenities Within Walking Distance."
The answer is D) 70-100.
Walk Score is a standardized measurement tool that evaluates walkability on a scale of 0-100. The scoring system is designed to reflect how convenient it is to live without a car. Higher scores indicate greater accessibility to amenities on foot. Understanding these categories helps buyers interpret walkability scores when evaluating potential homes. The scale is logarithmic, meaning that small improvements in score can represent significant improvements in walkability.
Walk Score: Algorithm-based measurement of walkability from 0-100
Transit Score: Measurement of public transportation access
Transit Ridership: Number of trips taken on public transit
• Walk Score ranges from 0-100 with specific categories
• Higher scores correlate with reduced car dependency
• Scores are based on proximity to amenities
• Use Walk Score as a starting point, not the final answer
•实地考察 neighborhoods during your preferred times
• Consider seasonal variations in walkability
• Relying solely on online scores without实地考察
• Not considering personal mobility needs
• Overlooking safety and infrastructure quality
Explain the factors that influence transit access quality and how they impact daily life for residents in walkable neighborhoods.
Service Frequency: The frequency of buses, trains, or other transit options directly impacts convenience. High-frequency service (every 10 minutes or less) allows for spontaneous trips without requiring precise scheduling, while low-frequency service (every 30+ minutes) requires advance planning and patience.
Route Coverage: The extent of transit network coverage determines how many destinations are accessible without a car. Good coverage connects residential areas to employment centers, shopping districts, and recreational facilities.
Reliability: Consistent and punctual service builds trust in the transit system. Unreliable service forces residents to keep cars as backup, reducing the benefits of transit access.
Integration: Seamless connections between different transit modes (bus to train, bike to bus) enhance the overall utility of the system. Poor integration requires longer travel times and more complex routing.
Cost: Affordable transit fares make car-free living financially viable. High costs can limit transit use even when service is available.
Impact on Daily Life: Good transit access reduces household transportation costs, provides mobility for those unable to drive, and supports environmental sustainability. It also influences where people choose to live and work, often increasing property values in well-connected areas.
Transit access quality is multifaceted and impacts residents' daily routines significantly. The quality of transit determines whether people can realistically live car-free or reduce car dependency. This affects not just transportation costs, but also lifestyle choices, environmental impact, and quality of life. Understanding these factors helps buyers evaluate whether a location meets their transportation needs and lifestyle preferences.
Service Frequency: How often transit vehicles arrive at stops
Route Coverage: Geographic extent of transit network
Transit-Oriented Development: Mixed-use development near transit stations
• Transit frequency directly impacts convenience
• Test transit service during your typical travel times
• Check for service changes during holidays or construction
• Consider the total trip time, not just wait time
• Only considering weekday service when working weekends
• Not accounting for late-night or early-morning travel needs
• Overlooking seasonal service changes
Sarah is evaluating two neighborhoods for her home purchase. Neighborhood A has a Walk Score of 85 and Transit Score of 40, while Neighborhood B has a Walk Score of 60 and Transit Score of 75. Sarah walks regularly for exercise and prefers to walk to errands, but also commutes to work 15 miles away using public transit. Calculate which neighborhood better suits her needs based on the weighted scoring system where walking has 60% weight and transit has 40% weight.
Neighborhood A Score: (85 × 0.6) + (40 × 0.4) = 51 + 16 = 67
Neighborhood B Score: (60 × 0.6) + (75 × 0.4) = 36 + 30 = 66
Analysis: Neighborhood A scores slightly higher (67 vs 66) based on Sarah's preferences. While Neighborhood B has superior transit access, Neighborhood A's significantly higher walkability better matches her preference for walking regularly and walking to errands. The difference is minimal, however, so Sarah should also consider other factors such as safety, aesthetics, and specific routes she'd use.
However, if Sarah's primary commute concern is her 15-mile journey to work, Neighborhood B's superior transit score might be more important for her daily routine. This highlights the importance of defining priorities clearly when evaluating neighborhoods.
This scenario demonstrates the importance of weighting different factors based on personal priorities. The mathematical calculation suggests Neighborhood A is slightly better, but real-world decision-making requires considering how the scores translate to actual daily experiences. Sarah's 15-mile commute is significant and might justify the slightly lower walkability if the transit connections are more reliable for her daily commute. This illustrates that quantitative analysis should be combined with qualitative considerations.
Weighted Scoring: Assigning importance values to different factors
Transit Connectivity: How well different routes connect to destinations
Walkshed: Area within walking distance of amenities
• Weight factors based on personal priorities
• Consider both daily needs and special trips
• Balance quantitative scores with qualitative factors
• Define your priorities before calculating scores
• Test actual routes for your most important destinations
• Consider seasonal variations in walkability
• Using equal weights for all factors regardless of needs
• Not considering peak travel times for transit
• Overlooking the difference between errands and commute
You're evaluating a neighborhood that has a high Walk Score (80) but you're concerned about pedestrian safety. What specific infrastructure and environmental factors should you look for to assess the actual safety of walking in this area?
Physical Infrastructure: Wide, well-maintained sidewalks free of obstacles; adequate street lighting; clearly marked crosswalks with visibility; traffic signals and stop signs; separated bike lanes if applicable.
Traffic Calming Features: Speed bumps, roundabouts, chicanes, and narrowed streets that slow vehicle speeds; raised crosswalks; median islands.
Visibility and Sight Lines: Clear sight lines at intersections; absence of vegetation or parked cars blocking views; well-lit pathways.
Crime and Security: Active street life with people present during walking hours; secure lighting in parking areas; visibility from windows onto streets.
Environmental Factors: Good drainage to prevent slippery surfaces; tree coverage for weather protection; benches for rest; accessibility features for all mobility levels.
实地Testing: Walk the routes yourself during the times you plan to walk; observe traffic speeds and driver behavior; note any safety concerns not apparent from maps.
This question highlights the difference between theoretical walkability and practical safety. A high Walk Score indicates proximity to amenities but doesn't necessarily mean safe walking conditions. Physical infrastructure and environmental factors significantly impact actual walkability experience. This emphasizes the importance of实地考察 over relying solely on online scores. The safest neighborhoods often combine high walkability scores with good infrastructure design.
Traffic Calming: Design features that slow vehicle speeds
Sight Lines: Clear visibility along streets and at intersections
Crime Prevention Through Environmental Design: Using design to reduce crime opportunities
• High Walk Score doesn't guarantee safe walking conditions
•实地考察 is essential for safety assessment
• Infrastructure quality affects actual walkability experience
• Walk your planned routes at different times of day
• Talk to local residents about safety experiences
• Check local crime statistics for the area
• Equating high Walk Score with safe walking
• Not testing routes during intended walking times
• Overlooking infrastructure quality in favor of proximity
Which street pattern is most conducive to walkability?
A grid pattern with connected streets is most conducive to walkability because it provides multiple routes between destinations, reduces travel distances, and increases intersection density. Grid patterns create shorter walking distances between points, offer route alternatives, and increase the number of destinations accessible within walking distance. This contrasts with cul-de-sacs and dead-end streets, which force longer walking routes and limit connectivity.
The answer is B) Grid pattern with connected streets.
Street network design significantly impacts walkability through the concept of "connectivity." Grid patterns create what urban planners call "fine-grained" networks with many intersections per square mile. This increases the likelihood that destinations will be within walking distance via multiple routes. The connectivity also provides route options for different preferences (scenic, quick, safe) and accommodates pedestrians when some paths are blocked. This fundamental principle explains why many historic urban neighborhoods are more walkable than post-WWII suburban developments.
Intersection Density: Number of intersections per square mile
Street Connectivity: Degree of interconnection between streets
Gridiron Pattern: Street layout with perpendicular intersecting streets
• Connected street networks enhance walkability
• Grid patterns provide multiple route options
• Cul-de-sacs reduce walking connectivity
• Look for neighborhoods with straight, connected streets
• Count intersections on maps to assess connectivity
• Consider how street patterns affect walking routes
• Assuming all residential areas have similar walkability
• Not considering how street patterns affect walking
• Overlooking the impact of connectivity on route options
FAQ
Q: How accurate are online walkability scores compared to实地评估?
A: Online walkability scores like Walk Score provide valuable initial insights but have limitations. They're based on proximity to amenities and don't capture quality factors like sidewalk condition, safety, lighting, or traffic speeds. A location might have a high score due to nearby amenities but be unpleasant or unsafe to walk to.实地评估 is crucial for understanding actual walkability experience. Online tools are best used as screening tools to identify promising areas for further实地 investigation.
Q: Is walkability more important for certain life stages?
A: Yes, walkability tends to be more important during certain life stages. Young professionals often value walkable neighborhoods for convenience and reduced transportation costs. Families with children appreciate walkability for safety and the ability to walk to schools, parks, and activities. Retirees may value walkability for maintaining mobility and social connections as driving becomes more challenging. However, individual preferences vary greatly, and some people prioritize other factors regardless of life stage.