Neighborhood Analysis for Long-Term Investment
Complete guide to evaluating investment potential • Step-by-step explanations
Neighborhood Analysis:
Show Analysis ToolAnalyzing neighborhoods for long-term investment potential requires examining multiple factors including demographics, economic indicators, market trends, and local infrastructure. This comprehensive evaluation helps identify areas with growth potential and sustainable returns.
Key analysis factors include:
- Demographics: Population growth, age distribution, and income levels
- Economic Indicators: Employment rates, job diversity, and income growth
- Market Trends: Price appreciation, rental yields, and inventory levels
- Infrastructure: Transportation, schools, and public services
- Future Development: Planned projects and zoning changes
Successful neighborhood analysis combines quantitative data with qualitative observations to predict long-term investment performance.
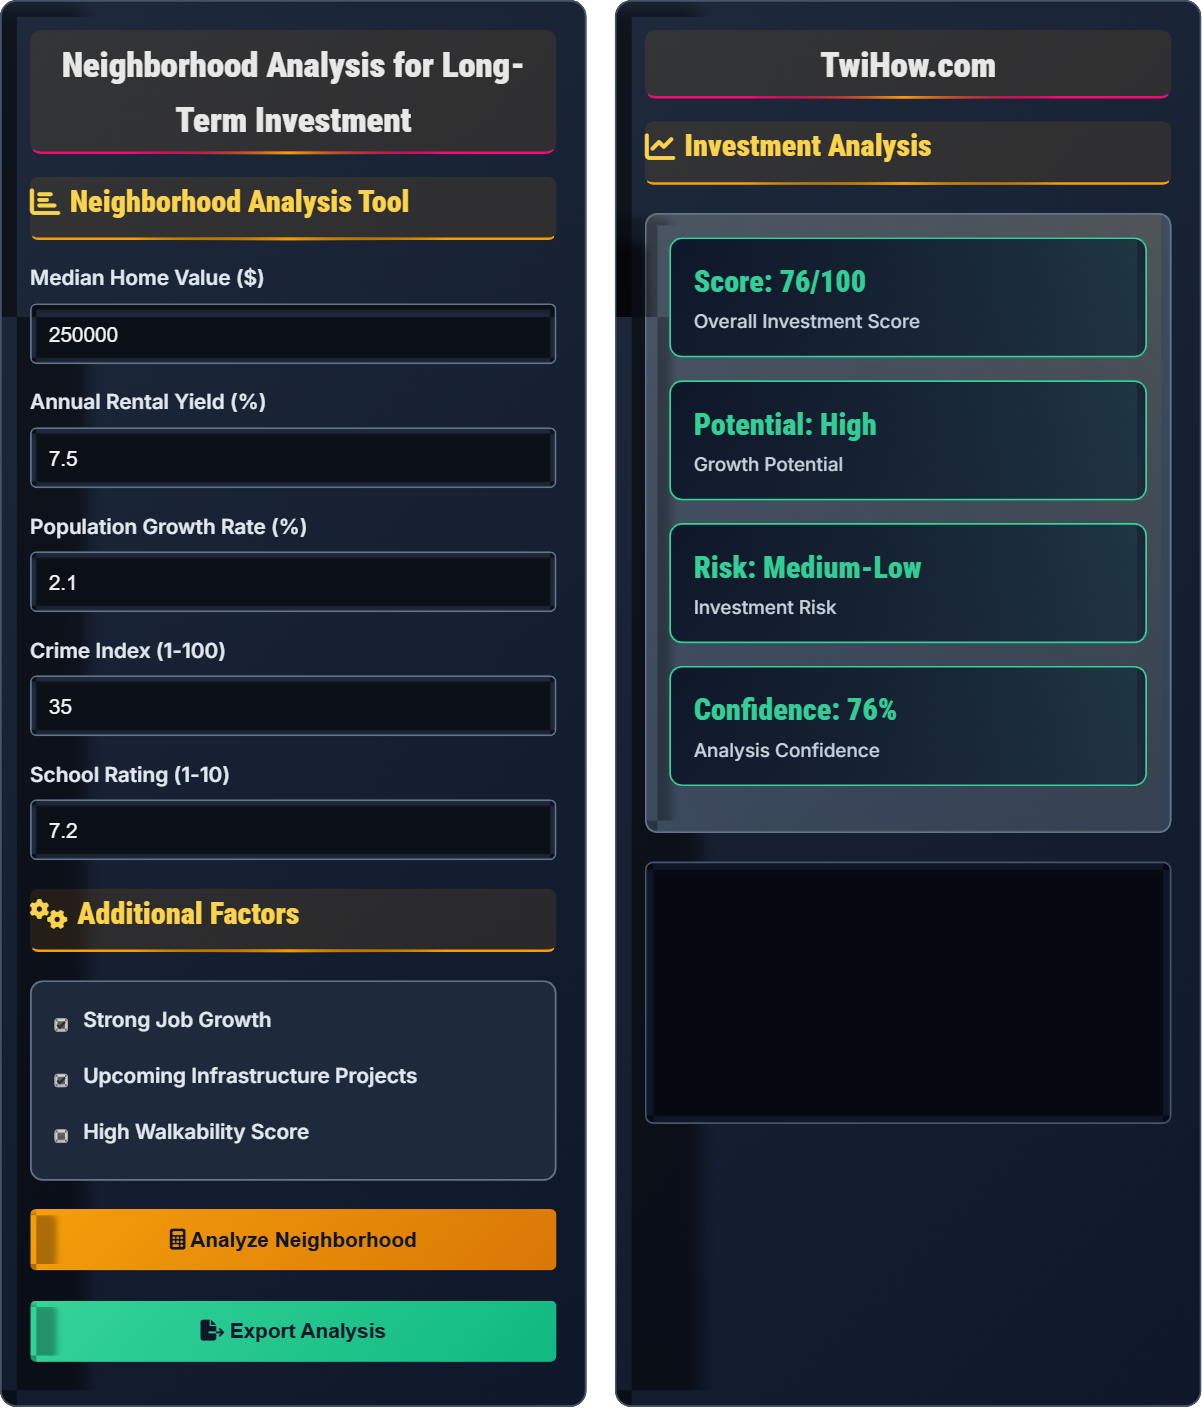
Neighborhood Analysis Tool
Additional Factors
Investment Analysis
| Factor | Score | Status |
|---|---|---|
| Population Growth | 85 | Strong |
| Rental Yield | 75 | Good |
| Crime Rate | 70 | Low |
| School Quality | 80 | Good |
Key Factors
- Steady population growth
- Competitive rental yields
- Low crime rates
- Good school ratings
Understanding Neighborhood Analysis
Neighborhood analysis is the systematic evaluation of a geographic area to determine its suitability for long-term real estate investment. This process examines various demographic, economic, and social factors to predict future property value appreciation and rental demand.
Key components include:
- Demographics: Population trends, age distribution, and income levels
- Economics: Employment rates, job diversity, and income growth
- Market Conditions: Supply and demand dynamics, price trends
- Infrastructure: Transportation, schools, healthcare, and utilities
Effective neighborhood analysis follows a structured approach:
Successful neighborhoods typically show:
- Population Growth: Consistent growth of 1-3% annually
- Job Creation: Diverse employment opportunities across sectors
- Income Growth: Median income rising with or above inflation
- Education Quality: Above-average school ratings
- Infrastructure Investment: Ongoing improvements in transportation and services
- Low Crime Rates: Declining or stable crime statistics
Warning signs that may indicate poor investment potential:
- Declining population
- Single-industry dependence
- Rising crime rates
- Deteriorating infrastructure
- Decreasing property values
- High vacancy rates
Analysis Methodology
Demographics, economics, market trends, infrastructure, future development.
Investment Score = (Population Growth × 20%) + (Economic Strength × 25%) + (Market Conditions × 20%) + (Infrastructure × 15%) + (Future Potential × 20%)
Where each factor is weighted based on importance to long-term investment success.
- Look for 3+ years of consistent growth
- Verify data with multiple sources
- Consider broader metropolitan trends
Data Sources
Census Bureau, Zillow, Redfin, local MLS, city planning departments.
- Collect demographic data from Census Bureau
- Research market trends from real estate platforms
- Review local economic reports
- Visit neighborhood in person
- Interview local residents and business owners
- Verify data accuracy
- Look for trend consistency
- Consider seasonal variations
- Account for local events
Neighborhood Analysis Quiz
Which demographic factor is most predictive of long-term property value appreciation?
The growing young adult population (25-35) is most predictive of long-term appreciation. This demographic typically includes first-time homebuyers with growing incomes and families, creating sustained demand for housing. They often start in rental properties and eventually purchase homes, supporting both rental and ownership markets.
The answer is B) Growing young adult population (25-35).
Demographic analysis focuses on populations that drive housing demand. Young adults in their prime earning and family-formation years create sustained housing demand. Elderly residents may downsize, students are temporary, and retirees may have different housing preferences.
Demographics: Statistical characteristics of a population
Prime Earning Years: Ages 25-50 when income typically grows fastest
Housing Demand: Need for residential properties
• Focus on income-generating demographics
• Consider family formation patterns
• Look for sustained growth trends
• Research employment opportunities for target demographic
• Consider proximity to job centers
• Look for educational institutions
• Focusing on temporary populations
• Ignoring employment factors
• Not considering life cycle changes
Explain why economic diversity is important for neighborhood investment potential and how to evaluate it.
Importance of Economic Diversity: Economic diversity protects neighborhoods from industry-specific downturns. Areas dependent on a single employer or industry are vulnerable to job losses and population decline.
Evaluation Methods:
Employment Distribution: Look for jobs across multiple sectors (technology, healthcare, manufacturing, retail, education).
Major Employers: Identify if any single employer represents more than 20% of local jobs.
Income Distribution: Healthy mix of income levels, not overly concentrated in one bracket.
Business Diversity: Variety of businesses and services serving different needs.
Growth Indicators: Consistent job creation across sectors over multiple years.
Areas with diverse economic bases are more resilient during economic downturns.
Economic diversity acts as a hedge against sector-specific risks. When one industry struggles, others may continue to thrive, maintaining employment and income stability. This diversification principle applies to real estate investment as it does to portfolio management.
Economic Diversity: Employment across multiple industry sectors
Resilience: Ability to withstand economic shocks
Employment Concentration: Over-reliance on single employer or industry
• Avoid single-employer towns
• Research local economic development plans
• Check unemployment rates
• Look for mixed-use developments
• Not researching employment distribution
• Ignoring single-employer risks
• Focusing only on current conditions
You're analyzing two neighborhoods: Suburb A has 2.5% annual population growth, median income of $65,000, good schools (8/10), but limited job diversity with one major factory employing 40% of residents. Suburb B has 1.8% population growth, median income of $58,000, decent schools (6/10), but diverse employment across healthcare, education, and tech. Which suburb has better long-term investment potential?
Analysis:
Suburb A Advantages:
• Higher population growth (2.5% vs 1.8%)
• Higher median income ($65,000 vs $58,000)
• Better schools (8/10 vs 6/10)
Suburb A Disadvantages:
• Heavy employment concentration (40% with single employer)
• High risk if factory closes
Suburb B Advantages:
• Economic diversity reduces risk
• More stable employment base
• Diverse job sectors provide resilience
Recommendation: Suburb B has better long-term potential despite weaker current metrics. Economic diversity provides stability during downturns and reduces single-point-of-failure risk.
This scenario demonstrates why risk assessment is crucial in neighborhood analysis. Current metrics like population growth and income are important, but sustainability factors like economic diversity often determine long-term success. Short-term advantages can be offset by structural vulnerabilities.
Single Point of Failure: Risk from over-dependence on one factor
Economic Resilience: Ability to withstand economic disruptionsRisk Assessment: Evaluating potential negative scenarios
• Balance current metrics with future risks
• Consider economic stability over growth
• Diversification reduces investment risk
• Look beyond surface metrics
• Research employment concentration
• Consider worst-case scenarios
• Focusing only on current performance
• Ignoring economic vulnerability
• Not considering employment risks
A neighborhood is planning a new light rail station and highway interchange. Currently, it has average property values and moderate growth. How should these infrastructure improvements affect your investment analysis?
Infrastructure Impact Analysis:
Positive Effects:
1. Improved Accessibility: Better transportation links increase desirability
2. Increased Property Values: Infrastructure typically drives appreciation
3. Enhanced Connectivity: Better access to job centers and amenities
4. Attracts Development: Infrastructure often triggers new construction
Considerations:
• Construction disruption during implementation
• Timeline for completion and impact
• Potential gentrification effects
• Increased property taxes due to improved infrastructure
Analysis Adjustment: Increase long-term growth potential score and adjust timeline expectations for value realization.
Infrastructure improvements are significant catalysts for neighborhood change. They increase accessibility and connectivity, making areas more attractive to residents and businesses. However, timing and implementation can affect the pace of value realization.
Accessibility: Ease of reaching destinations
Connectivity: Links to transportation networks
Catalyst: Factor that triggers significant change
• Infrastructure drives long-term value
• Consider construction disruption
• Evaluate implementation timeline
• Research project funding and timeline
• Look for complementary development
• Consider gentrification effects
• Not considering construction disruption
• Overestimating immediate impact
• Ignoring potential downsides
Which market indicator is most important for predicting long-term rental demand?
Population growth rate is the most important predictor of long-term rental demand. As population increases, housing demand grows proportionally. This creates sustained demand for both rental and owned properties. While current vacancy rates and price appreciation are important, they reflect short-term conditions rather than long-term trends.
The answer is B) Population growth rate.
Population growth is the fundamental driver of housing demand. Other factors like employment and income affect population growth, but population itself is the primary determinant of housing needs. This is a leading indicator rather than a lagging one.
Leading Indicator: Predicts future trends
Lagging Indicator: Reflects past performance
Housing Demand: Need for residential properties
• Population drives housing demand
• Focus on leading indicators
• Consider demographic trends
• Look for 3+ years of consistent growth
• Research migration patterns
• Consider job market stability
• Focusing only on current conditions
• Ignoring demographic trends
• Not considering population drivers
Frequently Asked Questions
Q: How far in advance should I look at neighborhood trends?
A: For long-term investment analysis, examine trends over 5-10 years:
Short-term (1-2 years): Identify current momentum and recent changes
Medium-term (3-5 years): Evaluate sustainability of trends
Long-term (5-10 years): Understand cyclical patterns and major shifts
Focus on 3-5 year trends for the most reliable predictions, but consider longer-term patterns to understand the neighborhood's evolution and resilience during economic cycles.
Q: What data sources are most reliable for neighborhood analysis?
A: Most reliable data sources include:
Government Sources:
• U.S. Census Bureau (demographics, income, population)
• Bureau of Labor Statistics (employment data)
• Local planning departments (zoning, development plans)
Real Estate Platforms:
• Zillow, Redfin, Realtor.com (price trends, inventory)
• Local MLS systems (detailed market data)
Local Sources:
• City/town websites (budgets, projects)
• Chamber of Commerce (business development)
• Local newspapers and government meetings
Always cross-reference multiple sources to verify accuracy and completeness.
Q: How do I balance current conditions with future potential?
A: Use a balanced scoring approach:
Current Conditions (40%):
• Rental yields and vacancy rates
• Property values and appreciation
• Crime rates and school quality
Future Potential (40%):
• Infrastructure projects
• Economic development plans
• Demographic trends
Risk Assessment (20%):
• Economic vulnerability
• Market volatility
• External factors
This approach balances proven performance with growth potential while accounting for risks.