What is Climate Change? Complete Guide to Climate Science
Climate fundamentals • Greenhouse effect • Step-by-step explanations
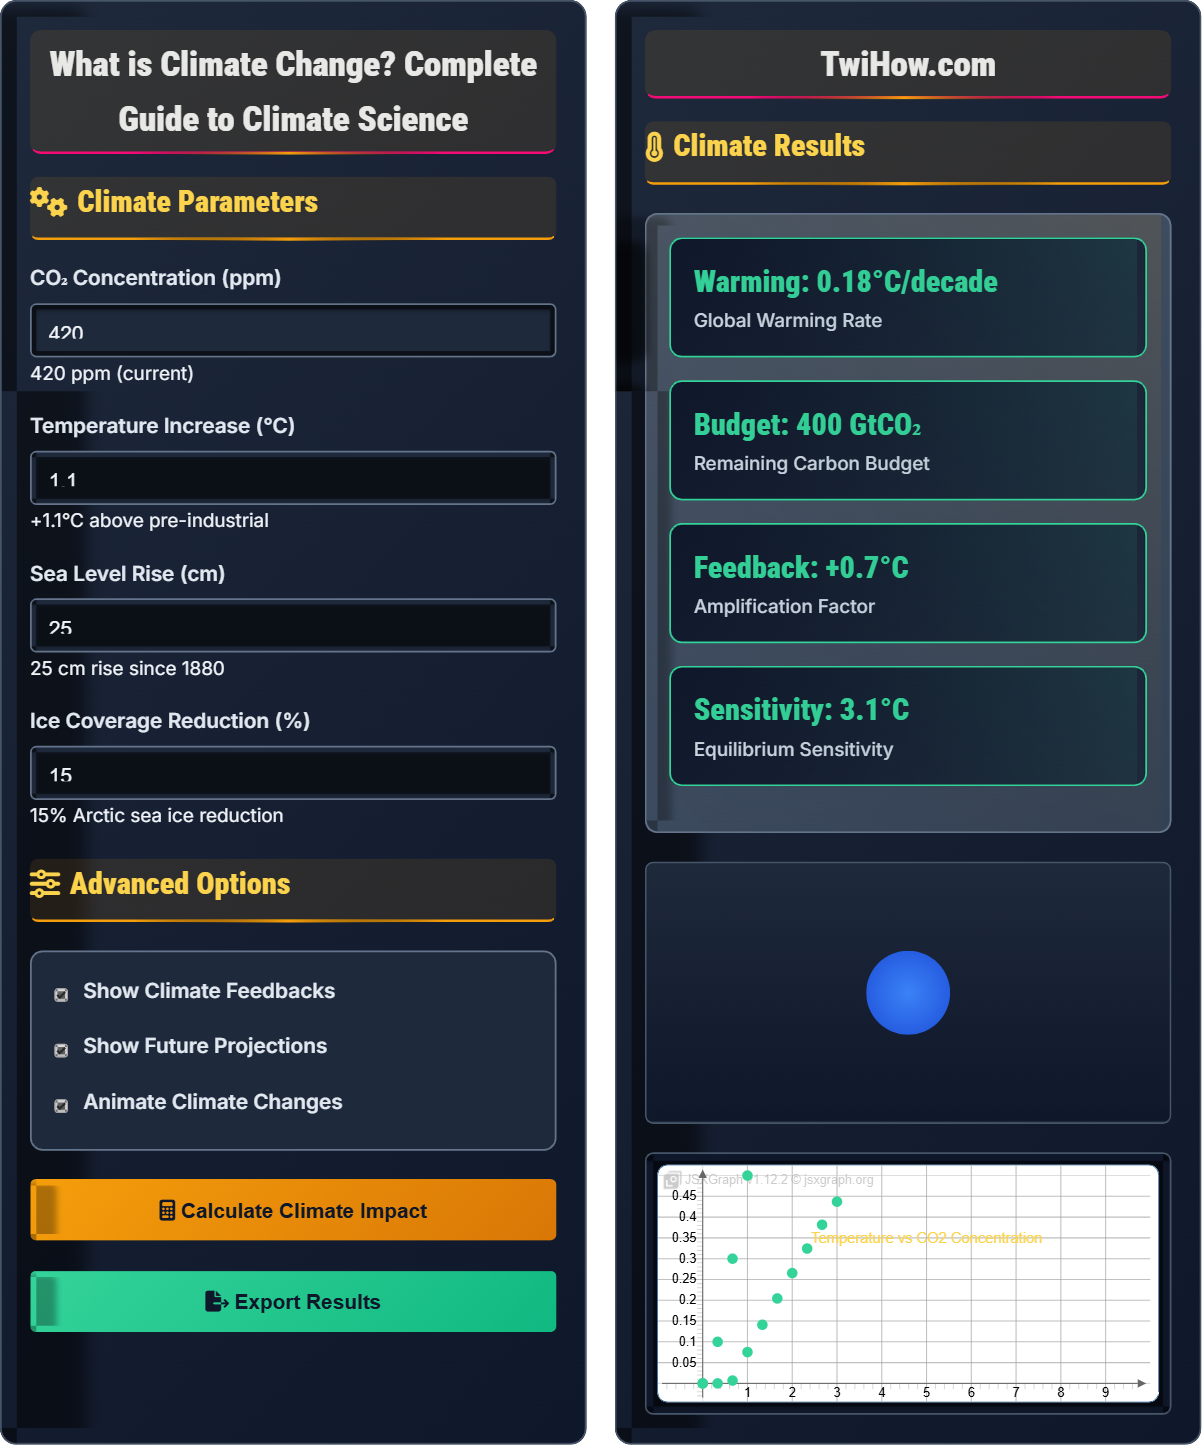
Climate System:
Show Climate SimulatorClimate change refers to long-term shifts in global temperatures and weather patterns, primarily caused by human activities that increase greenhouse gas concentrations in the atmosphere. The main driver is the enhanced greenhouse effect from carbon dioxide, methane, and other emissions from burning fossil fuels, deforestation, and industrial processes.
Key aspects of climate change:
- Greenhouse Effect: Natural process enhanced by human activities
- Feedback Loops: Amplifying mechanisms (ice-albedo, water vapor)
- Global Warming: Average temperature increase since industrial era
- Climate Impacts: Sea level rise, extreme weather, ecosystem changes
Climate change is a complex system involving interactions between atmosphere, oceans, land surfaces, and ice sheets, requiring coordinated global action to address.
Climate Parameters
Advanced Options
Climate Results
| Gas | Concentration | Contribution | Source |
|---|---|---|---|
| CO₂ | 420 ppm | 76% | Fossil fuels, deforestation |
| CH₄ | 1.9 ppm | 16% | Agriculture, waste |
| N₂O | 0.33 ppm | 6% | Fertilizers, industry |
| Other | Variable | 2% | Industrial gases |
Where ΔT is temperature change, λ is climate sensitivity parameter, and ΔF is radiative forcing. This equation shows how greenhouse gas increases drive temperature changes.
How Climate Change Works
Climate change refers to long-term shifts in global temperatures and weather patterns. While climate variations occurred naturally in the past, recent changes since the 1800s are primarily driven by human activities that increase greenhouse gas concentrations in the atmosphere. The main cause is the enhanced greenhouse effect from carbon dioxide, methane, and other emissions from burning fossil fuels, deforestation, and industrial processes.
Where:
- ΔT: Change in global temperature
- λ: Climate sensitivity parameter
- ΔF: Radiative forcing (W/m²)
Additionally, the Stefan-Boltzmann law relates temperature to energy: P = σT⁴, where P is power radiated, σ is Stefan-Boltzmann constant, and T is temperature in Kelvin.
Climate systems include important feedback loops that can amplify or dampen changes:
- Positive Feedback: Ice-albedo effect (less ice → darker surface → more heat absorption)
- Positive Feedback: Water vapor feedback (more warming → more evaporation → stronger greenhouse effect)
- Negative Feedback: Cloud formation (can reflect sunlight)
- Positive Feedback: Permafrost thawing (releases CO₂ and CH₄)
These feedbacks make climate projections complex and can accelerate warming beyond direct GHG effects.
- Climate Modeling: Predicting future temperature and precipitation
- Policy Making: Paris Agreement targets and carbon budgets
- Adaptation: Planning for sea level rise and extreme weather
- Renewable Energy: Transition to clean energy systems
- Agriculture: Crop planning for changing climate conditions
Climate Fundamentals
Greenhouse effect, radiative forcing, climate sensitivity, feedback loops, carbon budget.
ΔT = λΔF (Temperature change equals sensitivity times forcing)
Where ΔT = temperature change, λ = climate sensitivity, ΔF = radiative forcing.
- Greenhouse gases trap outgoing infrared radiation
- CO₂ has longest atmospheric lifetime
- Feedbacks amplify climate changes
- Carbon budget determines warming limits
Real-World Applications
Climate models, carbon pricing, renewable energy planning, infrastructure resilience.
- Global temperature monitoring stations
- Satellite atmospheric measurements
- Ice core and tree ring analysis
- Ocean temperature and pH monitoring
- Climate change occurs over decades
- Regional impacts vary significantly
- Irreversible changes possible at high warming
- Early action reduces costs
Climate Science Quiz
What is the primary mechanism by which greenhouse gases cause global warming?
Greenhouse gases cause global warming by absorbing and re-emitting infrared radiation that Earth emits back toward space. Solar radiation (shortwave) passes through the atmosphere and warms Earth's surface. The warmed surface then emits infrared radiation (longwave), which greenhouse gases absorb and re-emit in all directions, including back toward Earth, trapping heat.
This process increases the energy retained by Earth's climate system, raising global temperatures.
The answer is B) They trap outgoing infrared radiation.
This misconception is common - greenhouse gases don't block incoming solar radiation but trap outgoing terrestrial radiation. The atmosphere is largely transparent to incoming sunlight but opaque to outgoing infrared radiation at certain wavelengths. This creates the warming effect, similar to how glass traps heat in a greenhouse (though the actual mechanism is different).
Greenhouse Gas: Gas that absorbs infrared radiation
Radiative Forcing: Change in energy balance of climate system
Infrared Radiation: Longwave electromagnetic radiation
• GHGs absorb outgoing IR radiation
• Not blocking incoming solar radiation
• Different wavelengths behave differently
• Think: Sunlight in, heat trapped
• Glass is transparent to visible light
• GHGs absorb specific IR wavelengths
• Thinking GHGs block sunlight
Explain the concept of climate feedbacks and provide examples of both positive and negative feedback mechanisms. How do these feedbacks affect climate sensitivity?
Climate Feedback: A process where climate change leads to changes in other parts of the climate system that either amplify (positive feedback) or dampen (negative feedback) the original change.
Positive Feedbacks (amplify warming):
- Ice-Albedo Feedback: Warming melts ice → darker surface exposed → more solar absorption → more warming
- Water Vapor Feedback: Warming increases evaporation → more water vapor (GHG) → more warming
- Permafrost Feedback: Warming thaws permafrost → releases CO₂/CH₄ → more warming
- Cloud Feedback: Warming changes cloud cover → potentially amplifies warming
Negative Feedbacks (reduce warming):
- Planck Response: Warmer Earth emits more radiation → cooling effect
- Cloud Formation: More clouds can reflect sunlight → cooling effect
Effect on Climate Sensitivity: Positive feedbacks increase climate sensitivity (temperature change per forcing), while negative feedbacks decrease it. The net feedback determines how much Earth will warm for a given increase in greenhouse gases.
Feedbacks make climate science complex because they create non-linear responses. Small changes can be amplified significantly. Climate sensitivity includes these feedback effects. The range of uncertainty in climate projections largely stems from uncertainties in feedback strengths, particularly cloud feedback.
Climate Feedback: Process that amplifies or dampens climate change
Climate Sensitivity: Temperature change per CO₂ doubling
Albedo: Reflectivity of a surface
• Feedbacks can be positive or negative
• Net feedback determines sensitivity
• Uncertainties in feedbacks
• Positive feedbacks amplify change
• Negative feedbacks stabilize systems
• Most feedbacks are positive for warming
• Confusing positive with good
• Forgetting feedbacks affect sensitivity
• Thinking feedbacks are always stabilizing
Calculate how long the remaining carbon budget will last at current emission rates. If the remaining carbon budget to stay below 1.5°C is 400 GtCO₂ and current global emissions are 40 GtCO₂/year, how many years until the budget is exhausted? If emissions decrease by 5% annually, recalculate.
Scenario 1 - Constant Emissions:
- Remaining budget: 400 GtCO₂
- Annual emissions: 40 GtCO₂/year
- Years until budget exhausted: 400 ÷ 40 = 10 years
Scenario 2 - Decreasing Emissions (5% annually):
- Year 1: 40 GtCO₂
- Year 2: 40 × 0.95 = 38 GtCO₂
- Year 3: 38 × 0.95 = 36.1 GtCO₂
- Continuing this pattern...
- Sum of geometric series: S = a/(1-r) where a=40, r=0.95
- But we want S_n = 400, so: 400 = 40(1-0.95^n)/(1-0.95)
- 400 = 40(1-0.95^n)/0.05
- 400 = 800(1-0.95^n)
- 0.5 = 1-0.95^n
- 0.95^n = 0.5
- n = log(0.5)/log(0.95) = 13.5 years
With constant emissions, the budget lasts 10 years. With 5% annual reductions, it lasts about 13.5 years. This demonstrates the importance of emission reductions.
The carbon budget concept shows that cumulative emissions determine temperature rise. Reducing emissions slows budget depletion. The exponential decay calculation demonstrates how even modest annual reductions can extend the budget significantly. This mathematical approach helps understand the urgency of emission reductions.
Carbon Budget: Total emissions allowed to stay below temperature target
Cumulative Emissions: Total emissions over time
Geometric Series: Mathematical series with constant ratio
• Temperature depends on cumulative emissions
• Reducing emissions extends budget
• Even small annual reductions help
• Think in terms of cumulative emissions
• Annual reductions have compound effects
• Immediate action is more effective
• Forgetting cumulative nature of budget
• Not accounting for compound reductions
• Misunderstanding geometric series
Explain the concept of climate tipping points and their implications for climate policy. Give examples of potential tipping points and explain why they represent non-linear risks in climate change.
Climate Tipping Points: Critical thresholds where small changes can cause large, irreversible, and often abrupt changes in climate systems.
Examples of Tipping Points:
- West Antarctic Ice Sheet: Collapse could raise sea levels by 3-4m
- Greenland Ice Sheet: Complete loss could raise sea levels by 7m
- Amazon Rainforest: Drying could cause forest dieback
- Atlantic Meridional Overturning Circulation: Shutdown could disrupt weather patterns
- Arctic Sea Ice: Ice-albedo feedback could accelerate warming
Implications for Policy:
- Need to avoid crossing thresholds
- Irreversible changes possible
- Precautionary principle important
- Early action reduces risk
Non-Linear Risks: Tipping points represent non-linear responses where gradual changes in forcing can lead to sudden, large-scale changes in climate systems, making them particularly dangerous for climate policy.
Tipping points highlight the non-linear nature of climate systems. They represent thresholds where gradual warming can trigger sudden, large-scale changes. This creates risk that cannot be addressed by proportional responses - avoiding these thresholds requires early, aggressive action. The concept is crucial for understanding climate risk and the urgency of mitigation.
Tipping Point: Threshold for irreversible change
Non-Linear: Disproportionate response to forcing
Irreversible: Cannot return to original state
• Tipping points are irreversible
• Early warning systems important
Which of the following best describes how climate models work?
Climate models simulate average climate conditions over long periods (years to centuries) by solving fundamental physics equations governing atmospheric and oceanic dynamics. They incorporate fluid dynamics, thermodynamics, radiative transfer, and other physical processes.
Climate models are different from weather forecasts - they focus on statistical properties (mean, variability) rather than day-to-day weather. They solve equations based on fundamental physics rather than relying only on historical data. Modern climate models have been validated against paleoclimate data and historical climate changes.
The answer is B) They simulate average climate conditions over long periods.
This distinction is crucial - climate models project long-term averages, not specific weather events. They use fundamental physics equations to simulate the climate system. This is why climate projections have confidence intervals rather than exact predictions. The physics-based approach allows models to project climates not seen in the historical record.
Climate Model: Physics-based simulation of climate system
Weather Forecast: Short-term atmospheric prediction
Climate Projection: Long-term average prediction
• Climate ≠ Weather
• Models based on physics
• Project averages, not exact values
• Think: Climate is statistics of weather
• Models solve physics equations
• Uncertainty in details, not trends
• Confusing climate and weather
FAQ
Q: How do we know human activities are causing climate change?
A: Multiple lines of evidence show human causation: 1) Climate fingerprints match greenhouse gas increases from human activities, 2) Natural factors alone cannot explain observed warming, 3) Isotopic analysis shows CO₂ comes from fossil fuels, 4) Climate models reproduce observed changes only when human emissions are included, 5) Warming pattern matches physics predictions. The IPCC states it's "extremely likely" (>95% probability) that human influence is the dominant cause of warming since mid-20th century.
Q: What's the difference between climate and weather?
A: Weather refers to short-term atmospheric conditions (hours to weeks), while climate refers to long-term averages and statistics of weather (typically 30-year periods). Weather is what happens day-to-day, climate is what you expect over decades. Climate models project long-term averages and variability, not specific weather events. The distinction is like the difference between a single coin flip (weather) and the probability of heads over many flips (climate).
Q: Can climate models be trusted for future projections?
A: Climate models are validated against historical climate changes, paleoclimate data, and physical principles. They successfully reproduced the warming trend since 1900 when human emissions are included. Models have skill in projecting large-scale climate patterns. Uncertainty exists in details and timing, but confidence in trends is high. Models are essential tools for understanding climate, though they're continually improved. The range of model projections reflects real uncertainty, not model failure.