What is Conversion Rate?
Complete conversion rate guide • Optimization • Measurement
Conversion Rate Overview:
Calculate RateConversion rate is the percentage of website visitors who complete a desired action, such as making a purchase, filling out a form, or subscribing to a newsletter. It's a crucial metric that measures the effectiveness of your website and marketing efforts. Understanding and optimizing conversion rates is essential for business growth.
Key conversion rate components:
- Visitors: Total number of people visiting your website
- Conversions: Number of visitors who complete the desired action
- Goals: Specific actions you want visitors to take
- Tracking: Methods to measure and analyze conversions
- Optimization: Techniques to improve conversion rates
- Testing: Experimentation to find the best approaches
Effective conversion rate optimization increases revenue without necessarily increasing traffic, making it one of the most valuable marketing metrics.
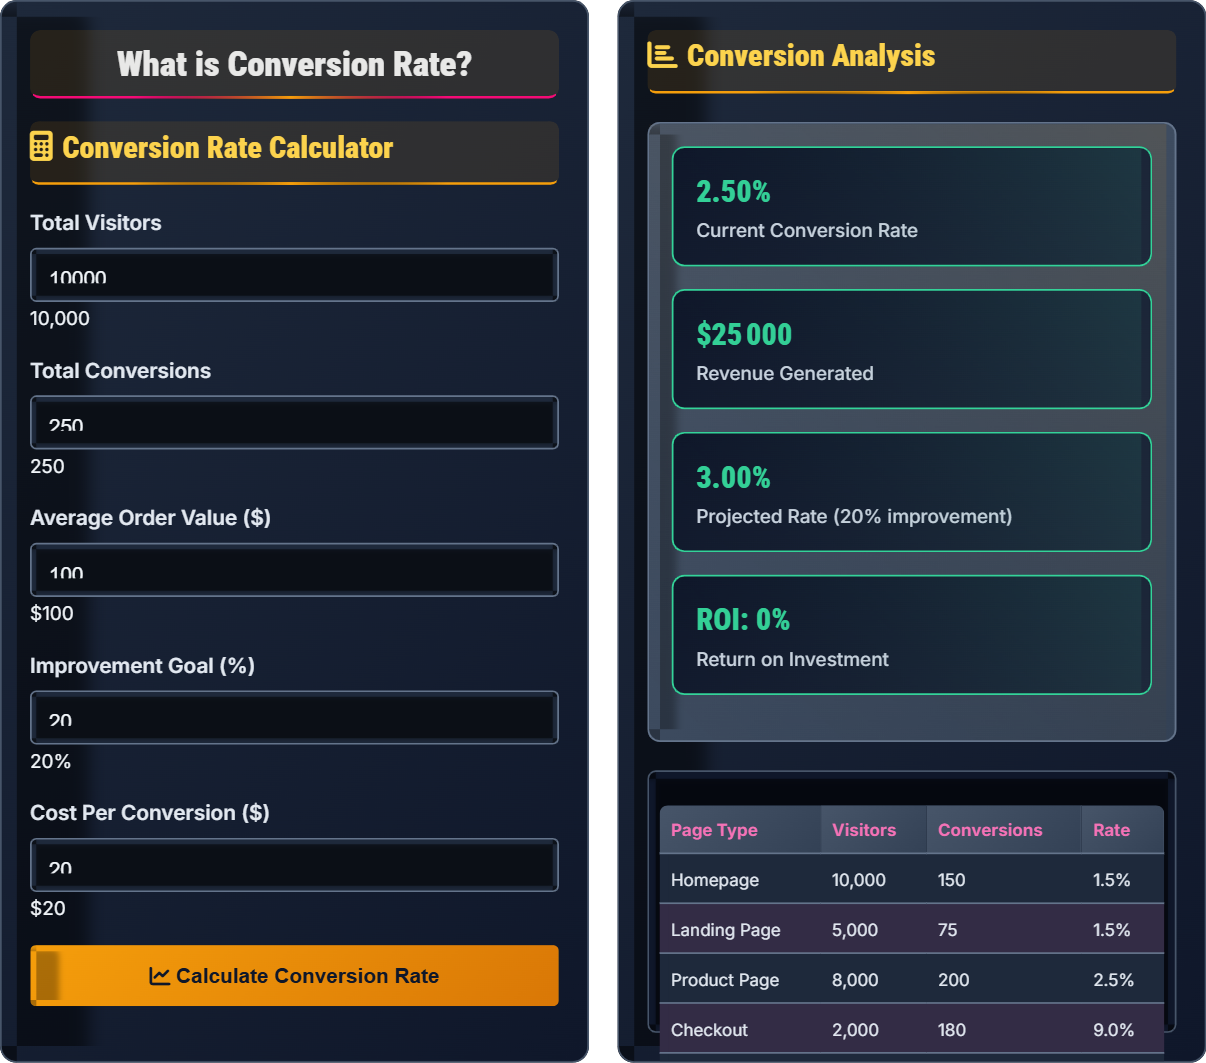
Conversion Rate Calculator
Conversion Analysis
| Page Type | Visitors | Conversions | Rate |
|---|---|---|---|
| Homepage | 10,000 | 150 | 1.5% |
| Landing Page | 5,000 | 75 | 1.5% |
| Product Page | 8,000 | 200 | 2.5% |
| Checkout | 2,000 | 180 | 9.0% |
| Thank You | 1,800 | 1,800 | 100% |
Conversion Rate Explained
Conversion rate is the percentage of website visitors who complete a desired action, such as making a purchase, filling out a form, or subscribing to a newsletter. It's calculated by dividing the number of conversions by the total number of visitors and multiplying by 100. Conversion rate is one of the most important metrics for measuring the effectiveness of your website and marketing campaigns.
Key areas where conversion rates provide value:
- E-commerce: Measuring purchase completion rates
- Lead Generation: Tracking form submissions and sign-ups
- Content Marketing: Measuring newsletter subscriptions
- App Downloads: Tracking app installation rates
- Video Completion: Measuring video viewing completion
- Event Attendance: Tracking registration and attendance
- Micro Conversions: Smaller actions that lead to larger goals (newsletter sign-up)
- Macro Conversions: Primary business goals (purchase, registration)
- Page-Level Conversions: Conversions specific to individual pages
- Journey Conversions: Conversions across multiple touchpoints
- Channel Conversions: Conversions by traffic source
- Device Conversions: Conversions by device type
Conversion Rate Components
Visitors represent the total number of people who visit your website or specific page during a given time period. This is the denominator in the conversion rate calculation.
- Google Analytics for comprehensive visitor tracking
- Server logs for raw traffic data
- Heatmap tools for visitor behavior
- Session recordings for detailed analysis
- UTM parameters for source tracking
- Custom event tracking for specific actions
Conversions are the specific actions that visitors take that are valuable to your business. These can vary depending on your business model and goals.
- Google Analytics goals and events
- Conversion pixels and tags
- E-commerce tracking for purchases
- Form submission tracking
- Phone call tracking
- Offline conversion tracking
Goals define what constitutes a conversion for your specific business. Setting clear, measurable goals is essential for accurate conversion rate tracking.
- Align goals with business objectives
- Set specific, measurable targets
- Define micro and macro conversions
- Create goal funnels
- Assign monetary values to goals
- Regular goal review and adjustment
Conversion Type Performance
Conversion Rate Funnel
Funnel Optimization:
- Visitors: Improve traffic quality and targeting
- Views: Optimize landing page experience
- Engagement: Enhance content and user experience
- Conversion: Simplify process and reduce friction
Conversion Rate Optimization
Optimization Best Practices:
- Conduct user research and testing
- Improve page loading speeds
- Optimize for mobile devices
- Enhance call-to-action buttons
- Add trust signals and social proof
- Run A/B tests regularly
Conversion Rate Quiz
If a website had 10,000 visitors and 250 conversions, what is the conversion rate?
Conversion rate is calculated using the formula: (Conversions ÷ Visitors) × 100. In this case: (250 ÷ 10,000) × 100 = 0.025 × 100 = 2.5%
The answer is B) 2.5%.
The conversion rate formula is fundamental to understanding digital marketing performance. It represents the percentage of visitors who complete a desired action. Remember that conversion rates are always expressed as percentages, and the formula remains consistent regardless of the specific action being tracked.
Conversion Rate: Percentage of visitors completing desired action
Visitors: Total number of people visiting website
Conversions: Successful completions of desired action
• Always use the same time period for both metrics
• Ensure conversions are properly tracked
• Compare rates across similar time periods
• Track multiple conversion types
• Segment by traffic source
• Monitor seasonal trends
• Mixing different time periods
• Not tracking all conversion types
• Comparing dissimilar metrics
Explain the key factors that influence conversion rates and provide examples of optimization techniques for each factor.
Key Factors Influencing Conversion Rates:
1. User Experience (UX): How easy and enjoyable it is to navigate your website. Optimization: Simplify navigation, improve site structure, enhance visual design.
2. Page Load Speed: How quickly your pages load. Optimization: Optimize images, minimize code, use content delivery networks.
3. Call-to-Action (CTA): Buttons and links that prompt action. Optimization: Use contrasting colors, clear text, strategic placement.
4. Trust Signals: Elements that build confidence. Optimization: Add testimonials, security badges, money-back guarantees.
5. Content Relevance: How well content matches visitor intent. Optimization: Improve targeting, create relevant landing pages.
6. Mobile Responsiveness: Performance on mobile devices. Optimization: Ensure mobile-friendly design, optimize touch interactions.
Conversion rate optimization involves removing friction and barriers that prevent visitors from completing desired actions. Each factor represents a potential obstacle that can be addressed through systematic testing and improvement. The key is identifying the most impactful factors for your specific audience and business model.
Friction: Barriers that impede user action
Trust Signals: Elements that build visitor confidence
Call-to-Action: Element prompting user action
• Test one element at a time
• Ensure statistical significance
• Conduct user testing sessions
• Use heatmaps and session recordings
• Analyze competitor strategies
• Making changes without testing
• Not considering mobile users
• Focusing only on aesthetics
A company currently has a 2% conversion rate with 100,000 monthly visitors. Their average order value is $100. They invest $10,000 in conversion rate optimization and achieve a 25% improvement in conversion rate. Calculate the return on investment for the optimization effort.
Current Performance:
Conversions: 100,000 × 2% = 2,000 conversions
Revenue: 2,000 × $100 = $200,000
After Optimization:
New conversion rate: 2% + (2% × 25%) = 2.5%
Conversions: 100,000 × 2.5% = 2,500 conversions
Revenue: 2,500 × $100 = $250,000
ROI Calculation:
Additional revenue: $250,000 - $200,000 = $50,000
ROI: ($50,000 - $10,000) ÷ $10,000 × 100 = 400%
The investment of $10,000 generated an additional $50,000 in revenue, resulting in a 400% return on investment.
Even small improvements in conversion rates can have significant financial impact due to the compounding effect of increased conversions. This demonstrates why conversion rate optimization is often more cost-effective than increasing traffic, as it maximizes the value of existing visitors.
ROI: Return on Investment calculation
Compounding Effect: Exponential growth from improvements
Cost-Effectiveness: Efficiency of investment
• Calculate actual financial impact
• Consider both direct and indirect benefits
• Account for implementation costs
• Focus on high-traffic pages first
• Calculate potential impact before investing
• Track long-term benefits
• Not calculating financial impact
• Focusing on vanity metrics
• Not considering opportunity cost
An e-commerce website has the following funnel: 10,000 visitors → 5,000 product views → 1,000 cart additions → 500 checkout starts → 450 purchases. Identify the biggest drop-off point and propose optimization strategies to improve the overall conversion rate.
Funnel Analysis:
Visitors to Product Views: 10,000 → 5,000 (50% conversion rate)
Product Views to Cart: 5,000 → 1,000 (20% conversion rate)
Cart to Checkout: 1,000 → 500 (50% conversion rate)
Checkout to Purchase: 500 → 450 (90% conversion rate)
Biggest Drop-off: Product Views to Cart (80% drop-off)
Optimization Strategies:
Product Page Improvements: Enhance product descriptions, add more images, include customer reviews, clarify pricing and shipping.
Cart Addition Optimization: Add "Add to Cart" buttons to category pages, implement wish lists, offer product recommendations.
Trust Building: Add security badges, money-back guarantees, return policy information.
Abandoned Cart Recovery: Implement email reminders, offer incentives for completion.
Funnel analysis reveals where visitors are dropping off in the conversion process. The biggest opportunity for improvement is typically at the steepest drop-off point. By focusing optimization efforts on these critical stages, you can achieve the greatest impact on overall conversion rates.
Funnel Analysis: Examining conversion stages
Drop-off Point: Stage with highest abandonment rate
Abandoned Cart: Items added to cart but not purchased
• Focus on biggest drop-off points
• Analyze reasons for abandonment
• Test solutions systematically
• Use heatmap tools to identify issues
• Conduct user testing
• Implement exit-intent popups
• Not analyzing the entire funnel
• Guessing instead of testing
• Focusing on minor issues first
What is the typical conversion rate range for e-commerce websites?
The typical conversion rate for e-commerce websites ranges from 1-3%. This benchmark varies by industry, season, and other factors, but 1-3% is considered the standard range. Websites with conversion rates above 3% are performing exceptionally well.
The answer is B) 1-3%.
Industry benchmarks provide context for evaluating your performance. While 1-3% may seem low, it represents a significant achievement considering the complexity of online shopping. Factors that influence e-commerce conversion rates include product type, price point, user experience, and market competition.
Benchmark: Standard for comparison
Industry Standard: Typical performance range
Exceptional Performance: Above-average results
• Compare to relevant industry benchmarks
• Focus on continuous improvement
• Consider your specific business factors
• Track your own historical performance
• Compare to competitors in your niche
• Set realistic improvement goals
• Comparing to irrelevant benchmarks
• Not considering business differences
• Expecting immediate improvements
Conversion Rate FAQ
Q: How often should I review and analyze my conversion rates?
A: Conversion rate review frequency:
Daily: Monitor for significant drops or spikes
Weekly: Analyze trends and patterns
Monthly: Comprehensive analysis and reporting
Quarterly: Strategic review and goal setting
Additionally, review rates whenever you make significant changes to your website or launch new campaigns. The key is maintaining consistent monitoring while allowing sufficient time for statistical significance in your data.
Q: Is it better to focus on increasing traffic or improving conversion rates?
A: Both are important, but conversion rate optimization often provides better ROI:
Conversion Rate Improvement: Maximizes value from existing traffic, often more cost-effective
Traffic Increase: Brings more potential customers, but may include lower-quality visitors
Optimal Strategy: Improve conversion rates first to maximize current traffic value, then scale traffic with the knowledge of your improved conversion rate.
For example, a 10% improvement in conversion rate from 2% to 2.2% on 10,000 visitors equals 20 additional conversions. To achieve the same result through traffic increase, you'd need 1,000 additional visitors, which costs more than optimizing conversion rates.