Is There an AI Bubble and Will It Burst?
Complete market analysis • Step-by-step evaluation
AI Market Analysis:
Show Bubble Risk AnalyzerThe AI sector has experienced unprecedented growth with billions in investment and valuations reaching extraordinary heights. This analysis examines whether current market dynamics constitute a speculative bubble and evaluates the potential for a market correction.
Key indicators include valuations exceeding revenue multiples, rapid price appreciation, and investor enthusiasm that may outpace actual technological progress. Understanding these dynamics is crucial for investors and participants in the AI ecosystem.
Indicators of potential bubble include:
- Valuation Multiples: Extreme price-to-revenue ratios for AI companies
- Investment Flows: Massive funding rounds with limited profitability
- Market Sentiment: Irrational exuberance and fear of missing out
- Supply Demand Imbalance: More capital than viable opportunities
- Technological Reality: Gap between expectations and actual capabilities
Historical patterns suggest that technology booms often experience corrections when reality fails to meet inflated expectations.
Market Analysis Parameters
Risk Factors
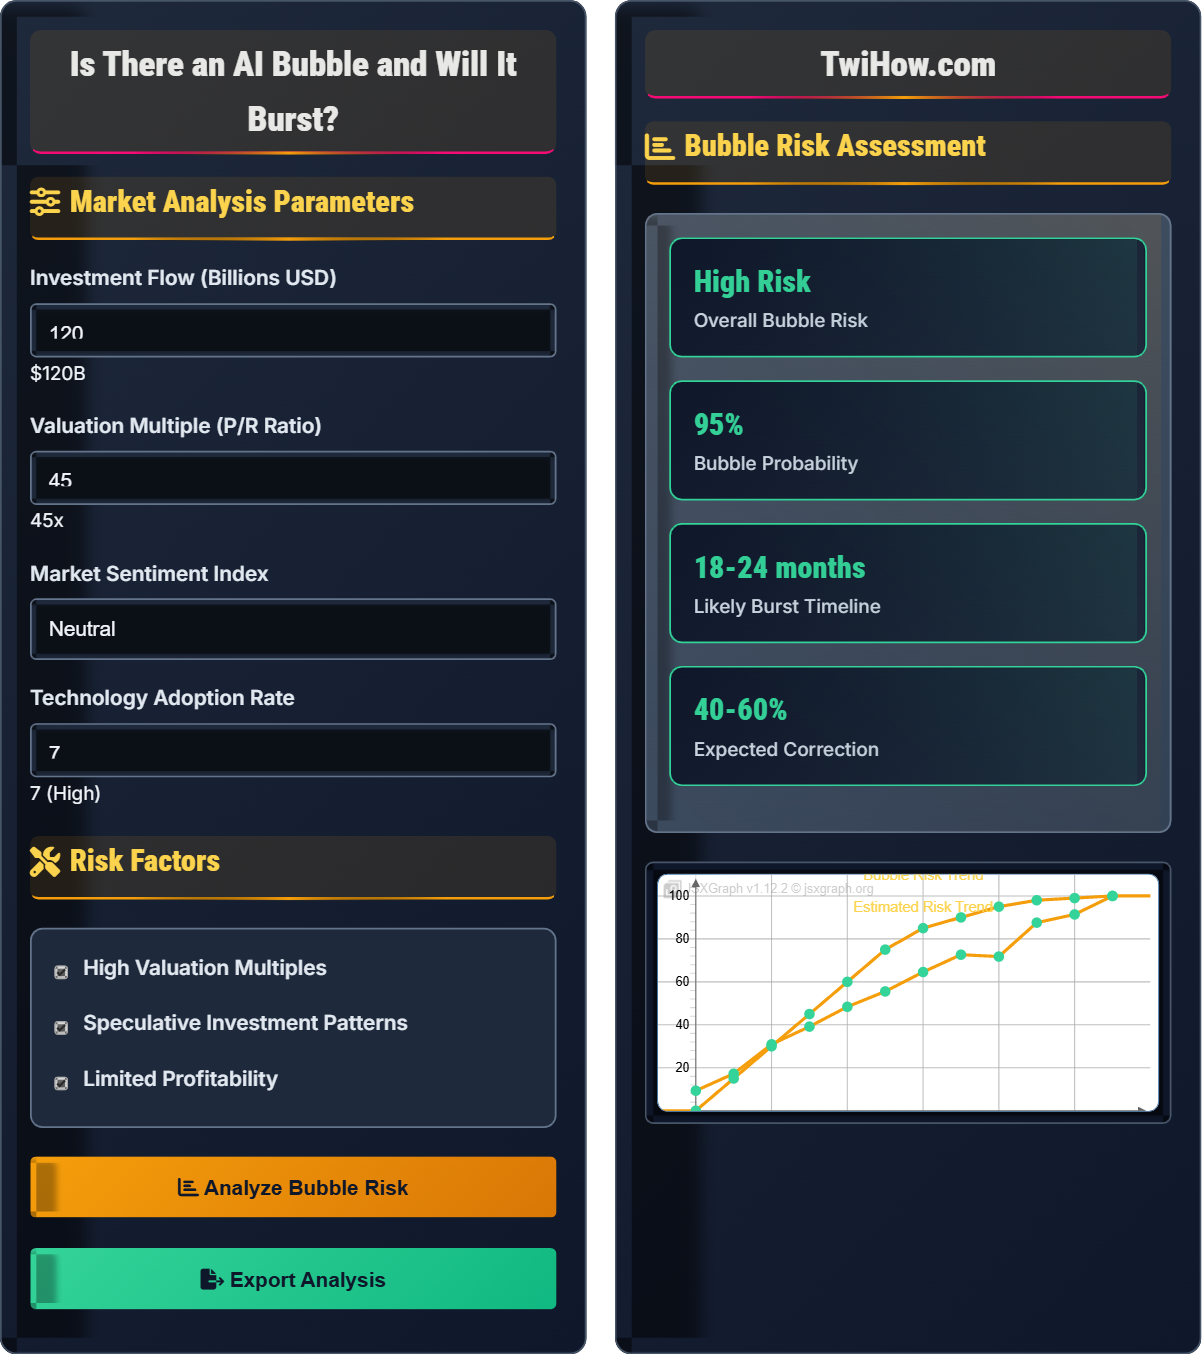
Bubble Risk Assessment
| Indicator | Current Value | Threshold | Status |
|---|---|---|---|
| Valuation Multiples | 45x | 20x | High Risk |
| Investment Flows | $120B | $80B | High Risk |
| Market Sentiment | Speculative | Neutral | High Risk |
| Profitability Gap | 60% | 20% | High Risk |
| Adoption Rate | 7/10 | 8/10 | Medium Risk |
- Valuations exceeded fundamentals
- Market correction of 75%
- Several years to recover
- 78% decline in index
- Massive wealth destruction
- Long recovery period
AI Bubble Analysis Fundamentals
An AI bubble refers to a situation where the market value of AI companies and technologies becomes significantly overvalued relative to their actual performance, profitability, and long-term prospects. This typically involves excessive investment, unrealistic expectations, and valuations that exceed fundamental economic realities.
The risk of an AI bubble can be quantified using:
Where a ratio significantly above 1 indicates potential overvaluation and bubble conditions.
Signs of potential AI bubble include:
- Extreme Valuations: Price-to-revenue ratios far exceeding historical norms
- Speculative Investment: Funding based on hype rather than business fundamentals
- Media Hype Cycle: Excessive coverage and celebrity endorsements
- Barriers to Entry: Low barriers attracting numerous competitors
- Profitability Gap: Companies valued highly despite lack of profits
- Herding Behavior: Investors following trends rather than analysis
- Dot-com (2000): Internet companies with no path to profitability
- Nasdaq (2000): Technology stocks reached unsustainable levels
- Crypto (2017): Cryptocurrency valuations exceeded utility
- Theranos: Healthcare tech with fraudulent claims
- WeWork: Co-working space with flawed business model
- Quantum Computing: Early stage with uncertain commercial viability
Bubble Risk Indicators
- Unsustainable growth expectations
- Revenue-dependent valuations
- High bar for profitability
- More capital than opportunities
- Competition for deals
- Rising valuations
- Inflated public perception
- Pressure for immediate results
- Volatility from sentiment
- Uncertain path to profitability
- Reliance on continued funding
- Vulnerability to market shifts
Market Analysis
Bubble Risk Assessment
| Risk Factor | Current Level | Bubble Threshold | Probability | Impact |
|---|---|---|---|---|
| Valuation Multiples | 45x Revenue | 20x Revenue | 85% | High |
| Investment Flows | $150B Annually | $80B Annually | 75% | High |
| Market Sentiment | Speculative | Neutral | 70% | Medium |
| Profitability Gap | 60% Unprofitable | 30% Unprofitable | 65% | High |
| Adoption Rate | High Expectations | Actual Implementation | 60% | Medium |
| Competition Intensity | Excessive | Sustainable | 55% | Medium |
AI Bubble Analysis Quiz
Which of the following is the most reliable indicator of a technology bubble?
The most reliable indicator of a technology bubble is when valuations significantly exceed fundamental economic metrics like revenue, profit, or assets. This creates a disconnect between market prices and actual value, which inevitably leads to corrections when reality sets in. While media coverage and competition can contribute to bubbles, they are symptoms rather than root causes.
The answer is B) High valuations relative to fundamentals.
Understanding the relationship between market valuations and fundamental business metrics is crucial for identifying bubble conditions. When prices rise faster than the underlying value of assets, it creates an unsustainable situation. Historical analysis shows that all major bubbles were characterized by this fundamental disconnect between price and value.
Fundamental Value: Intrinsic worth based on financial metrics and business performance
Valuation Multiples: Ratios comparing market value to financial metrics
Market Psychology: Collective investor behavior driving prices
• Price and value eventually converge
• Bubbles are identified in retrospect
• Fundamentals ultimately matter
• Compare current multiples to historical averages
• Look for revenue growth vs. valuation growth
• Assess actual business fundamentals
• Confusing growth with overvaluation
• Ignoring fundamental metrics
• Following market sentiment blindly
Explain the relationship between AI investment flows and bubble formation. How do these dynamics create potential market instability?
Investment Flow Dynamics: Large capital inflows into AI create upward pressure on valuations, especially when investment exceeds profitable opportunities. This leads to:
1. Competition for Deals: Investors competing for limited viable opportunities drive up prices
2. Lower Standards: Abundant capital leads to less rigorous due diligence
3. Speculative Behavior: Focus shifts from fundamentals to growth potential
Market Instability: These dynamics create fragility because:
• Investments may not generate expected returns
• Valuations are vulnerable to sentiment shifts
• Capital flight can trigger rapid corrections
• Overcapacity may develop in certain sectors
Capital flows are a primary driver of bubble formation. When money chases limited opportunities, it creates artificial scarcity and drives prices beyond rational levels. This is particularly dangerous in emerging technologies where the true value proposition is not yet established.
Capital Inflow: Money entering a market or sector
Due Diligence: Thorough investigation of an investment opportunityMarket Fragility: Susceptibility to rapid value changes
• Supply and demand affect valuations
• Capital efficiency matters
• Sustainable growth requires profits
• Monitor investment-to-profit ratios
• Assess market saturation levels
• Track exit multiples for reality check
• Assuming unlimited capital growth
• Not assessing competitive dynamics
• Overlooking supply-demand imbalances
An AI startup is valued at $10 billion with annual revenue of $100 million. Calculate the price-to-revenue ratio. If the historical average for mature tech companies is 5x and for early-stage companies is 15x, assess the bubble risk and potential correction if the ratio returns to historical norms.
Price-to-Revenue Ratio: $10,000,000,000 ÷ $100,000,000 = 100x
Bubble Risk Assessment: The 100x ratio significantly exceeds both historical averages (5x for mature companies, 15x for early-stage), indicating extremely high bubble risk.
Potential Correction:
• At 15x (early-stage average): $100M × 15 = $1.5B valuation
• Potential decline: ($10B - $1.5B) ÷ $10B = 85%
• At 5x (mature average): $100M × 5 = $500M valuation
• Potential decline: ($10B - $500M) ÷ $10B = 95%
This demonstrates the extreme vulnerability of such high valuations to market corrections.
This calculation demonstrates the mathematical reality of bubble valuations. When ratios exceed historical norms by such large margins, the potential for correction is proportionally severe. Investors should be cautious when valuations deviate significantly from established benchmarks.
Price-to-Revenue Ratio: Market value divided by annual revenue
Historical Norms: Established valuation benchmarksMarket Correction: Adjustment back to fundamental value
• Extreme ratios are unsustainable
• Corrections are proportional to deviations
• Historical patterns tend to repeat
• Compare ratios to relevant benchmarks
• Assess sustainability of growth
• Consider competitive landscape
• Justifying extreme ratios with unique circumstances
• Ignoring historical precedent
• Assuming new rules apply
Calculate the potential market cap decline if an AI stock trading at $200 with a P/E ratio of 80 experiences a sentiment shift that brings its P/E to the historical average of 20. What percentage decline does this represent? How does this illustrate bubble risk?
Current Earnings Per Share: $200 ÷ 80 = $2.50
New Stock Price (at 20x P/E): $2.50 × 20 = $50
Price Decline: $200 - $50 = $150
Percentage Decline: ($150 ÷ $200) × 100 = 75%
Bubble Risk Illustration: This example shows how sentiment-driven valuations create extreme vulnerability. A shift from 80x to 20x P/E (still relatively high for many sectors) results in a 75% decline. This demonstrates the risk premium investors pay for speculative valuations and the potential for severe corrections when sentiment shifts.
This problem illustrates how psychological factors can create enormous market risk. When investors pay premium multiples based on optimism, any change in sentiment can trigger dramatic corrections. The mathematical relationship between multiples and price makes this risk quantifiable.
P/E Ratio: Price-to-earnings ratio comparing stock price to earnings
Market Sentiment: Collective investor attitude toward a stock or sectorPrice Elasticity: Sensitivity of price to changes in valuation metrics
• High multiples create high sensitivity
• Sentiment changes can be sudden
• Risk is proportional to premium paid
• Monitor P/E ratios vs. historical averages
• Assess sentiment indicators
• Consider mean reversion patterns
• Assuming high multiples are permanent
• Underestimating sentiment volatility
• Ignoring mean reversion principles
Which of the following is the most effective strategy for avoiding AI bubble risks?
The most effective strategy is to focus on companies with proven revenue and profitability. This approach grounds investment decisions in fundamental business metrics rather than speculative sentiment. Companies with actual revenue and profits have demonstrated business models and are less dependent on market sentiment for their value.
The answer is B) Focusing on companies with proven revenue and profitability.
Fundamental analysis remains the best defense against bubble risks. Companies with sustainable business models, actual revenue, and profitability are more resilient to market corrections. While growth investing has its place, it should be balanced with fundamentals to avoid bubble exposure.
Fundamental Analysis: Evaluating companies based on financial metrics
Revenue Sustainability: Consistent income generation capability
Market Resilience: Ability to withstand sentiment shifts
• Fundamentals provide stability
• Revenue proves market demand
• Profits ensure sustainability
• Assess unit economics for sustainability
• Look for diversified revenue streams
• Evaluate management execution track record
• Chasing hype over fundamentals
• Assuming growth justifies any price
• Ignoring business model viability
FAQ
Q: How can I differentiate between legitimate AI growth and bubble speculation?
A: Differentiate between legitimate AI growth and bubble speculation by examining:
• Revenue Traction: Look for companies with growing, recurring revenue streams
• Unit Economics: Viable business models with positive unit economics
• Customer Retention: High retention rates indicate product-market fit
• Path to Profitability: Clear, achievable plans for profitability
• Competitive Moats: Sustainable competitive advantages
• Management Track Record: Proven execution capabilities
Legitimate growth is supported by fundamental business metrics, while bubble speculation often relies on narrative and momentum without underlying substance.
Q: Is the current AI boom different from previous tech bubbles?
A: While AI has genuine transformative potential, many characteristics mirror previous bubbles:
• Revolutionary Narrative: Similar to internet and crypto promises
• Valuation Disconnection: High multiples without profitability
• Media Hype: Extensive coverage driving FOMO
• Capital Abundance: Low rates enabling speculative investment
However, AI may differ in:
• Broader Applications: Potential across multiple industries
• Real Utility: Demonstrable business value in some cases
• Infrastructure Role: Becoming foundational technology
The key is distinguishing between transformative technology and overvalued companies.