What are the key metrics for measuring software quality?
Complete quality metrics guide • Step-by-step explanations
Software Quality Metrics:
Show Quality AnalyzerSoftware quality metrics are quantitative measures used to assess the quality of software products and processes. These metrics provide objective insights into various aspects of software quality, including maintainability, reliability, efficiency, and security. Key metrics help teams identify areas for improvement, track progress over time, and make data-driven decisions about software quality.
Effective quality metrics cover multiple dimensions: code quality (complexity, coverage), defect metrics (density, resolution time), performance indicators (response time, throughput), and process metrics (development velocity, release frequency). These metrics should be tailored to organizational goals and project requirements.
Key concepts:
- Code Coverage: Percentage of code exercised by tests
- Cyclomatic Complexity: Measure of code complexity and testability
- Defect Density: Number of defects per unit of code
- Technical Debt: Effort required to fix code quality issues
Modern quality metrics incorporate automated tooling, continuous monitoring, and predictive analytics to proactively identify and address quality issues.
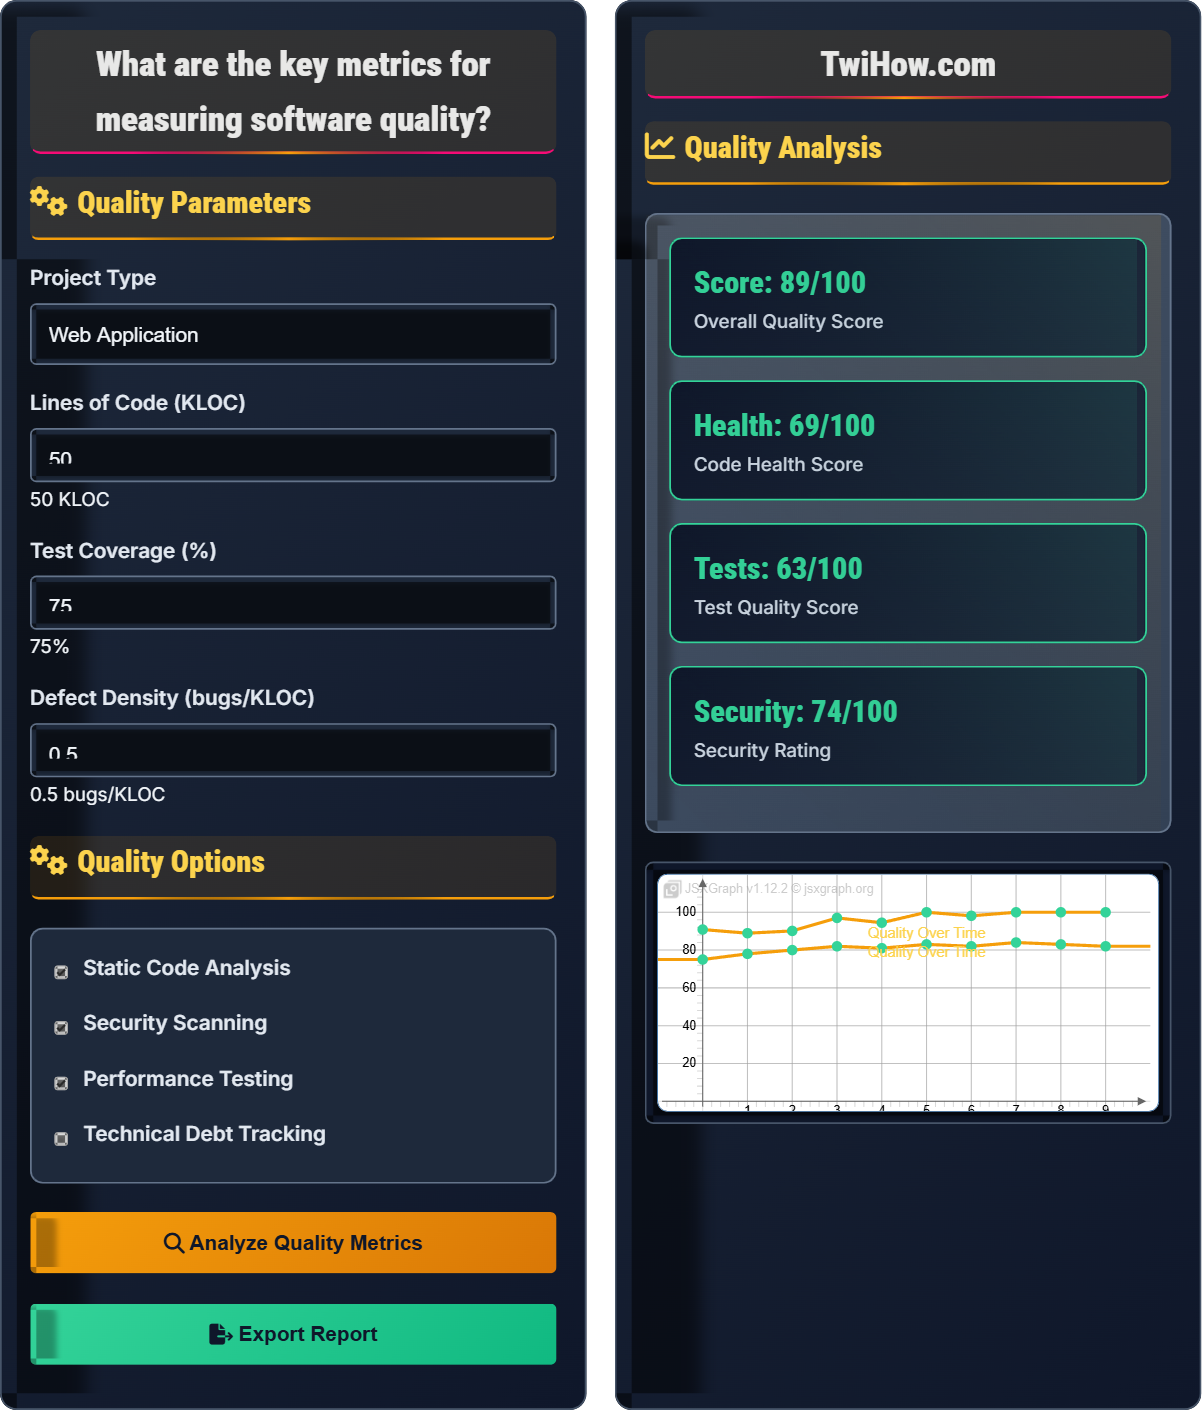
Quality Parameters
Quality Options
Quality Analysis
| Metric | Current | Target | Status |
|---|---|---|---|
| Test Coverage | 75% | 80% | ⚠ Needs Improvement |
| Code Complexity | 12 | 10 | ⚠ Moderate |
| Defect Density | 0.5 | 0.3 | ⚠ Above Target |
| Security Issues | 8 | 0 | ✗ Critical |
Software Quality Metrics Explained
Software quality metrics are quantitative measures used to assess the quality of software products and processes. These metrics provide objective insights into various aspects of software quality, including maintainability, reliability, efficiency, and security. Key metrics help teams identify areas for improvement, track progress over time, and make data-driven decisions about software quality.
Key metrics in software quality measurement:
Core metrics include:
- Code Coverage: Percentage of code exercised by tests
- Cyclomatic Complexity: Measure of code complexity and testability
- Defect Density: Number of defects per unit of code
- Technical Debt: Effort required to fix code quality issues
- Security Vulnerabilities: Number and severity of security issues
Major software quality measurement tools and platforms:
- SonarQube: Comprehensive code quality and security platform
- ESLint: Static analysis tool for JavaScript/TypeScript
- Checkmarx: Static application security testing
- OWASP ZAP: Dynamic security testing tool
- JaCoCo: Java code coverage tool
- Coveralls: Code coverage tracking service
- Automate Collection: Use CI/CD pipelines for continuous measurement
- Set Meaningful Targets: Define realistic and achievable goals
- Track Trends: Monitor metrics over time for improvement
- Balance Metrics: Use multiple metrics to avoid gaming
- Act on Results: Implement improvements based on findings
- Communicate Results: Share metrics with stakeholders
Quality Metrics Fundamentals
Code coverage, cyclomatic complexity, defect density, technical debt, maintainability.
Quality_Score = (Code_Coverage + Maintainability + Security_Score) ÷ Complexity_Factor
Where Quality_Score = overall quality rating, Code_Coverage = test coverage percentage.
- Measure what matters
- Set realistic targets
- Track trends over time
Metric Categories
Code quality, test quality, security, performance, maintainability.
- Static analysis
- Dynamic testing
- Security scanning
- Performance testing
- Tool integration
- Reporting frequency
- Threshold setting
- Actionability
Quality Metrics Learning Quiz
What is the generally accepted minimum code coverage threshold for production code?
The generally accepted minimum code coverage threshold for production code is 80%. While 100% coverage is ideal, it's often impractical and may lead to diminishing returns. The 80% threshold provides a good balance between thorough testing and development efficiency. However, it's important to note that code coverage is just one metric and doesn't guarantee bug-free code.
The answer is C) 80%.
Code coverage measures the percentage of code that is executed by tests, but it doesn't measure the quality of those tests. High coverage with poor tests is less valuable than moderate coverage with well-designed tests. The 80% rule is a guideline, not a hard requirement, and should be adjusted based on the application's criticality and risk profile.
Code Coverage: Percentage of code exercised by automated tests
Branch Coverage: Percentage of conditional branches tested
Statement Coverage: Percentage of statements executed
• Coverage doesn't guarantee quality
• Focus on critical paths
• Balance coverage with efficiency
• Aim for 80% but prioritize critical code
• Use branch coverage for complex logic
• Combine with other quality metrics
• Chasing 100% coverage blindly
• Not considering test quality
• Ignoring critical paths
Explain cyclomatic complexity, how it's calculated, and why it's important for software quality. What are the recommended thresholds for different types of code?
Cyclomatic Complexity:
Cyclomatic complexity measures the number of independent paths through a program's source code. It's calculated as: CC = E - N + 2P, where E = number of edges, N = number of nodes, and P = number of connected components.
Calculation Example:
Simple method with no loops or conditionals: CC = 1
Method with one if statement: CC = 2
Method with two if statements: CC = 3
Importance:
• Indicates testing complexity
• Correlates with maintenance effort
• Helps identify refactoring opportunities
Recommended Thresholds:
• 1-10: Simple, well-understood code
• 11-20: More complex, requires additional review
• 21-50: Very complex, high risk
• >50: Untestable, requires refactoring
Lower complexity generally correlates with better maintainability and fewer defects.
Cyclomatic complexity is a structural metric that helps quantify how complex a piece of code is from a testing perspective. Each decision point (if, while, for, etc.) creates a new path that needs to be tested, increasing the complexity. This metric helps identify code that may be difficult to test and maintain.
Cyclomatic Complexity: Number of linearly independent paths through code
Decision Points: Statements that alter program flow (if, while, etc.)
Independent Paths: Different execution paths through code
• Keep complexity below 10 for methods
• Break complex methods into smaller ones
• Use design patterns to reduce complexity
• Focus on critical business logic
• Ignoring complexity in calculations
• Not refactoring high-complexity code
• Measuring complexity without action
A software project has 50,000 lines of code and has had 125 defects found in production over the past year. Calculate the defect density and interpret what this means for the software quality. How does this compare to industry benchmarks?
Calculation:
Defect Density = (Number of Defects) ÷ (Size of Code in KLOC)
Defect Density = 125 ÷ (50,000 ÷ 1,000) = 125 ÷ 50 = 2.5 defects per KLOC
Interpretation:
A defect density of 2.5 defects per KLOC is relatively high compared to industry standards. For well-tested enterprise applications, the target is typically 0.1-0.5 defects per KLOC. This suggests the software may have quality issues that need addressing.
Industry Benchmarks:
• Excellent: 0.1 - 0.5 defects/KLOC
• Good: 0.5 - 1.0 defects/KLOC
• Average: 1.0 - 2.5 defects/KLOC
• Poor: >2.5 defects/KLOC
This software falls in the "average to poor" range and would benefit from improved testing and quality processes.
Defect density provides a normalized measure of software quality that allows comparison across projects of different sizes. It's important to consider the type of defects (critical vs. minor) and the testing process when interpreting this metric. A high defect density could indicate issues with development processes, testing adequacy, or code review practices.
Defect Density: Number of defects per unit of code size
KLOC: Thousand Lines of Code
Production Defects: Defects found after release
• Normalize by code size
• Consider defect severity
• Track trends over time
• Track different defect types separately
• Consider pre-production defects
• Use historical data for benchmarks
• Not normalizing by code size
• Mixing defect severities
• Not considering context
Your team has identified that their codebase has accumulated significant technical debt. The static analysis tool reports 500 code smells, 25 code duplications, and 150 security vulnerabilities. Estimate the effort required to address this technical debt and propose a strategy for gradual improvement.
Technical Debt Assessment:
Effort Estimation:
• Code Smells (500): 5-15 minutes each = 42-125 hours
• Code Duplications (25): 30-60 minutes each = 13-25 hours
• Security Vulnerabilities (150): 1-4 hours each = 150-600 hours
Total Estimated Effort: 205-750 hours
Improvement Strategy:
1. Priority-Based Approach: Address security vulnerabilities first
2. Incremental Refactoring: Dedicate 10-15% of each sprint to debt reduction
3. Prevention: Implement quality gates and code reviews
4. Measurement: Track debt reduction progress
Implementation:
• Create technical debt backlog items
• Allocate time in each sprint for refactoring
• Set up automated quality checks in CI/CD
• Establish coding standards and review processes
Technical debt accumulates over time when teams take shortcuts for immediate delivery. Addressing it requires a systematic approach that balances ongoing development with quality improvements. The key is to make debt reduction a regular part of the development process rather than a separate activity.
Technical Debt: Future cost of current shortcuts
Code Smell: Surface indication of deeper problems
Refactoring: Improving code without changing functionality
• Address security issues first
• Make debt reduction routine
• Prevent accumulation of new debt
• Use automated tools for identification
• Prioritize by business impact
• Track debt metrics continuously
• Ignoring technical debt
• Trying to fix all at once
• Not preventing new debt
Which of the following combinations of metrics would provide the most comprehensive view of software quality?
The combination of test coverage, defect density, security vulnerabilities, and performance metrics provides the most comprehensive view of software quality. This covers multiple quality dimensions: code quality (coverage), reliability (defect density), security (vulnerabilities), and performance (performance metrics). A balanced set of metrics prevents gaming and provides a holistic view of software quality.
The answer is B) Test coverage, defect density, security vulnerabilities, and performance metrics.
Effective quality dashboards use multiple metrics to provide a balanced view of software quality. Relying on a single metric can lead to gaming behavior where teams optimize for that metric at the expense of overall quality. A comprehensive approach covers code quality, reliability, security, and performance dimensions.
Quality Dashboard: Visual representation of quality metrics
Balance Scorecard: Multiple metrics to prevent gaming
Quality Dimensions: Different aspects of software quality
• Use multiple quality dimensions
• Include security metrics
• Track both static and dynamic metrics
• Include both leading and lagging indicators
• Focus on actionable metrics
• Show trends over time
• Using too few metrics
• Focusing only on code metrics
• Not including security metrics
FAQ
Q: How do I choose the right quality metrics for my project?
A: Choosing quality metrics requires considering your project context:
Factors to Consider:
• Project criticality (financial, safety, security implications)
• Team size and experience
• Available tools and infrastructure
• Stakeholder requirements
Recommended Approach:
• Start with 3-5 key metrics
• Include code quality, test coverage, and defect metrics
• Add security metrics for sensitive applications
• Focus on metrics that drive action
• Regularly review and adjust based on effectiveness
Choose metrics that are actionable, measurable, and aligned with business goals.
Q: What are the costs and benefits of implementing quality metrics?
A: Quality metrics have both costs and benefits:
Costs:
• Tool licensing and setup
• Team time for implementation and monitoring
• Potential for metrics gaming
• Overhead of reporting and analysis
Benefits:
• Early detection of quality issues
• Data-driven decision making
• Improved customer satisfaction
• Reduced maintenance costs
• Better predictability
ROI: Studies show that quality metrics can reduce maintenance costs by 20-50% and improve delivery predictability significantly.
Q: How do I integrate quality metrics into our CI/CD pipeline?
A: Integrating quality metrics into CI/CD:
Tools Integration:
• Static analysis tools (SonarQube, ESLint) in build steps
• Code coverage tools (JaCoCo, Istanbul) with test execution
• Security scanners (OWASP ZAP, Snyk) in security checks
Quality Gates:
• Fail builds if metrics fall below thresholds
• Generate quality reports and dashboards
• Send notifications for metric changes
Best Practices:
• Start with lenient thresholds
• Gradually tighten as quality improves
• Provide clear guidance for failures
• Track metrics over time for trends